
Designing automated time-series reports
About the company
ScaleXP is a seed-funded B2B focussed data insights company. The tightly-knit team of 7 works remotely and is spread across 4 continents. Headquartered in London, the primary customer base included businesses in the US, UK, Europe, and Australia.
Role and responsibility
Leading the design efforts for ScaleXP software experience. Testing and establishing value proposition for upcoming product features by conducting customer interviews. In parallel, taking ownership in defining Design principles, creating user-journey flows, prototyping high-fidelity mockups, and building a component library. Also helping set up the company's design function.
Internally, I collaborate with Suezann (CEO), Thimo and Ameur (Tech), and Sonam (Marketing).
Scope of this project
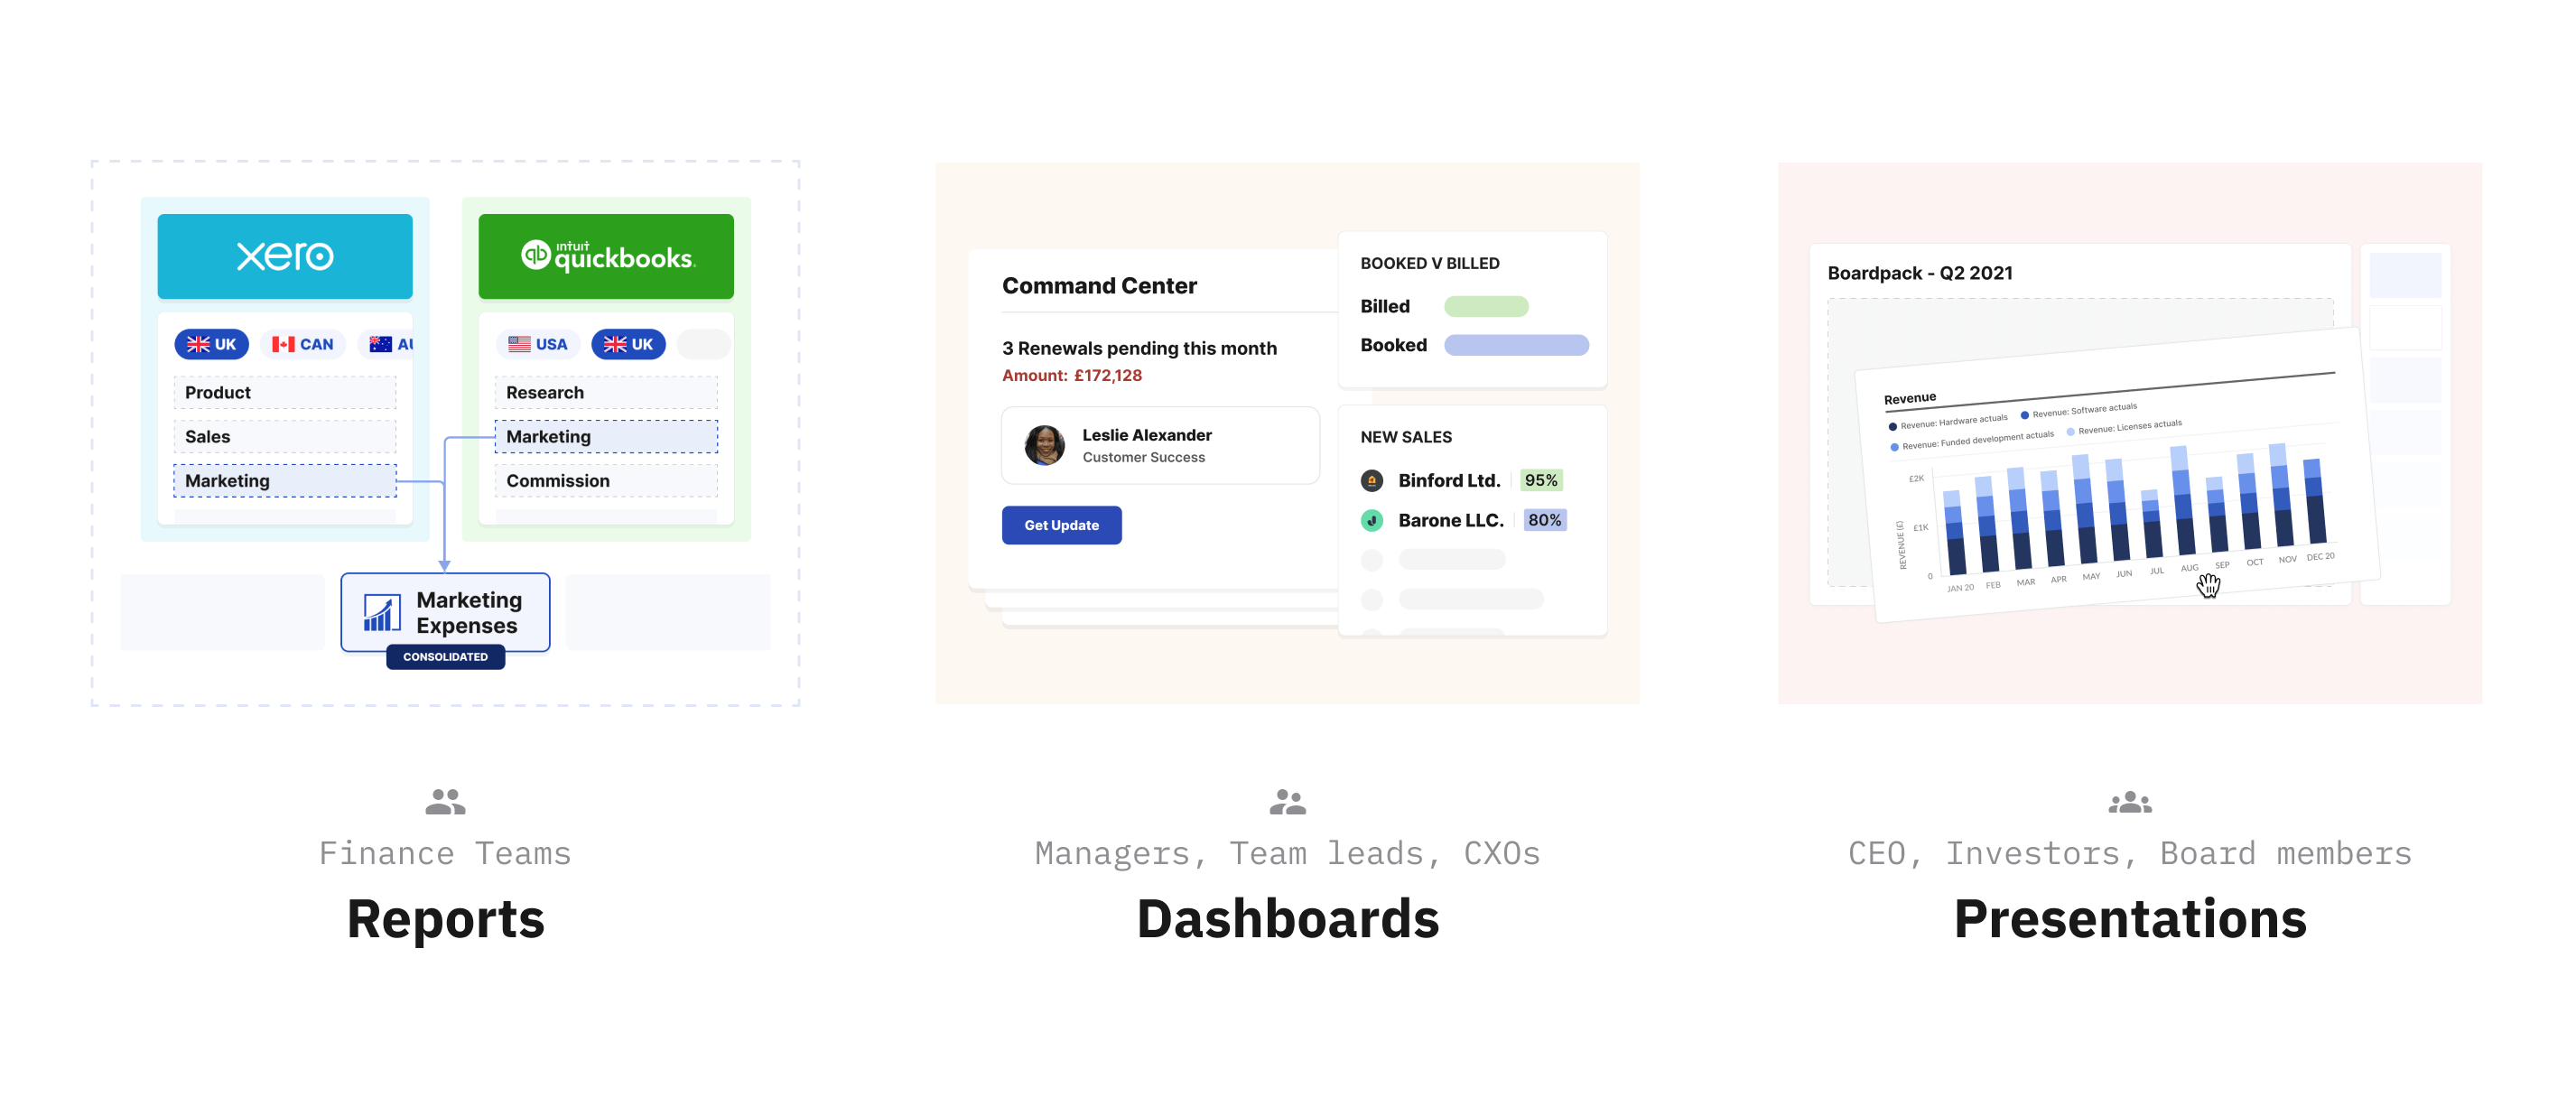
As a product, ScaleXP has 3 main value propositions for the user:
- Reports: Create time-series financial and business reports. Primary user persona: Finance teams.
- Dashboards: Map the report's data into dashboards and charts for analytics. Primary user persona: CXOs.
- Presentations: Share financial reports and analytics data to relevant stakeholders. Primary user persona: CEO, Investors, Board members.
The reports section is the most used part of the product (analytics tracked on Posthog). Given its impact on the user's workflow, it is critical to ensure that the experience in creating and editing reports is smooth.
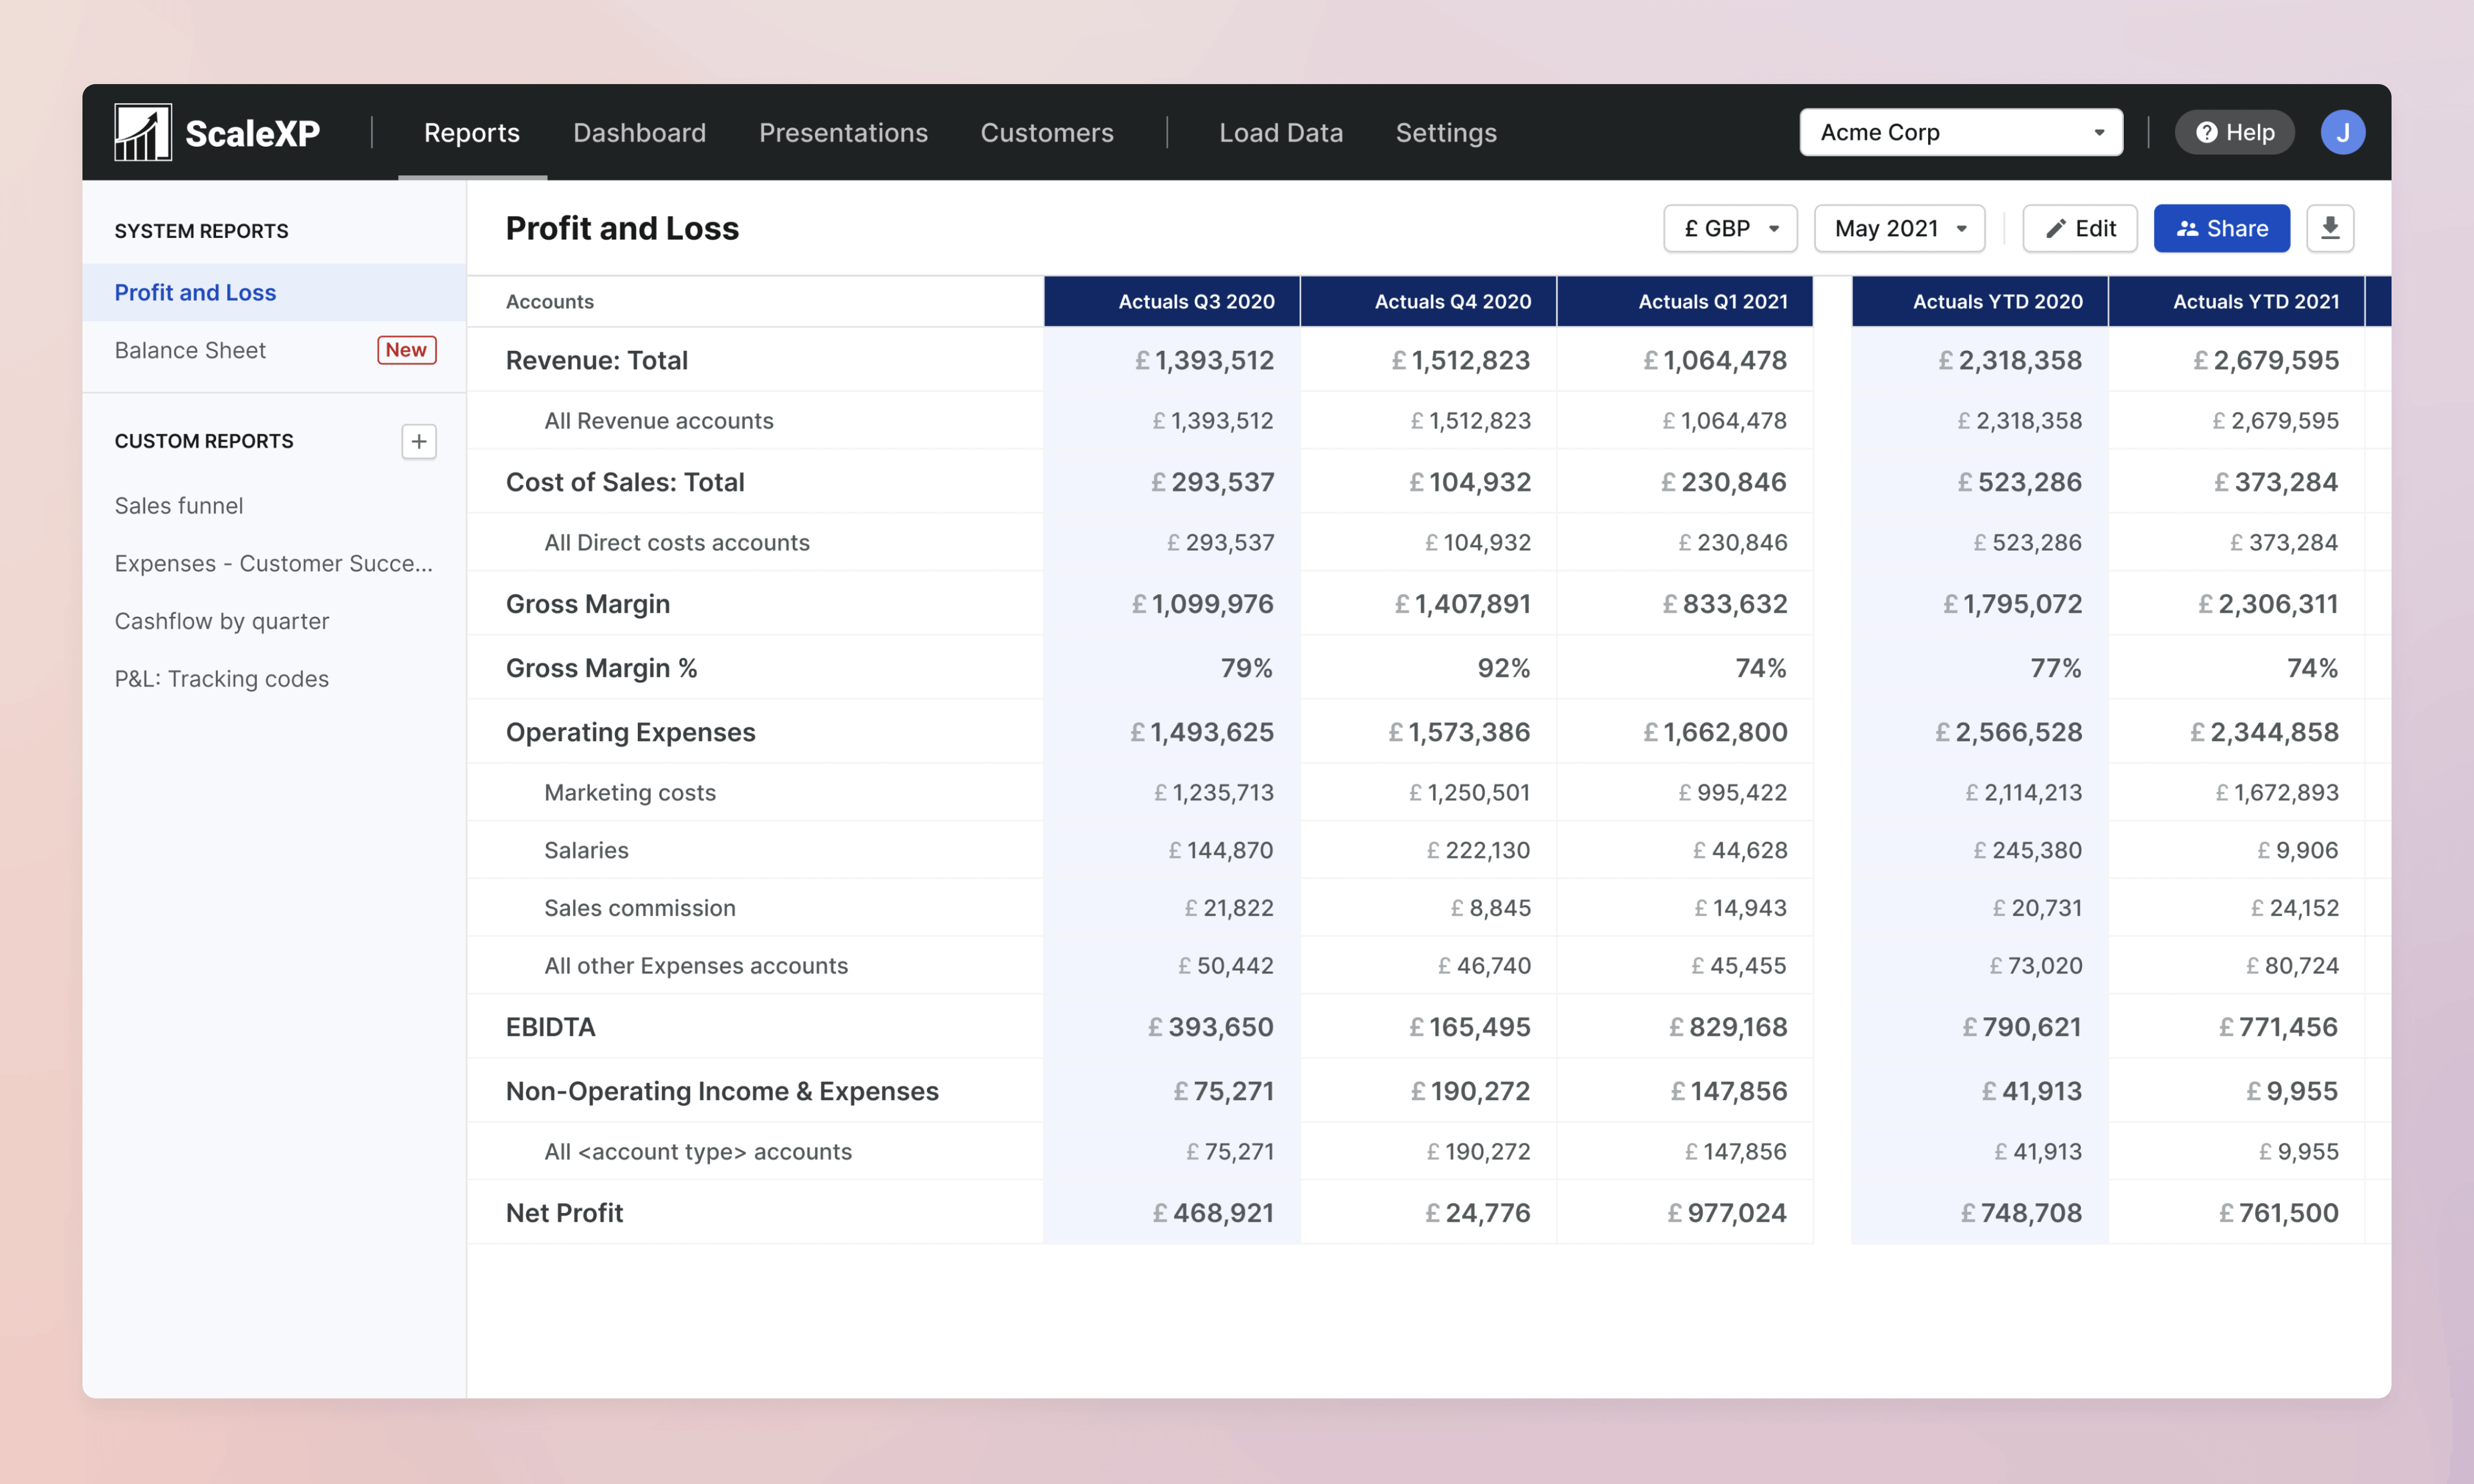
Sample ScaleXP report
With the help of customer interviews every week, the team recognized that the report's functionality was limiting in certain areas. This project aimed to tackle those limitations in ScaleXP reports.
Problem
Problem 1: Lack of flexible column setup in reports
While creating or editing a report, the user can choose the column configuration from a list of presets (predefined by the system). But as businesses from multiple geographies and sectors started being part of the customer base, the requirement of more flexible columns arose; as it became difficult to maintain a single preset list to satisfy every unique use-case.
e.g. Almost every country follows a different financial reporting standard; which further affects reporting to any relevant stakeholder (board members, investors).
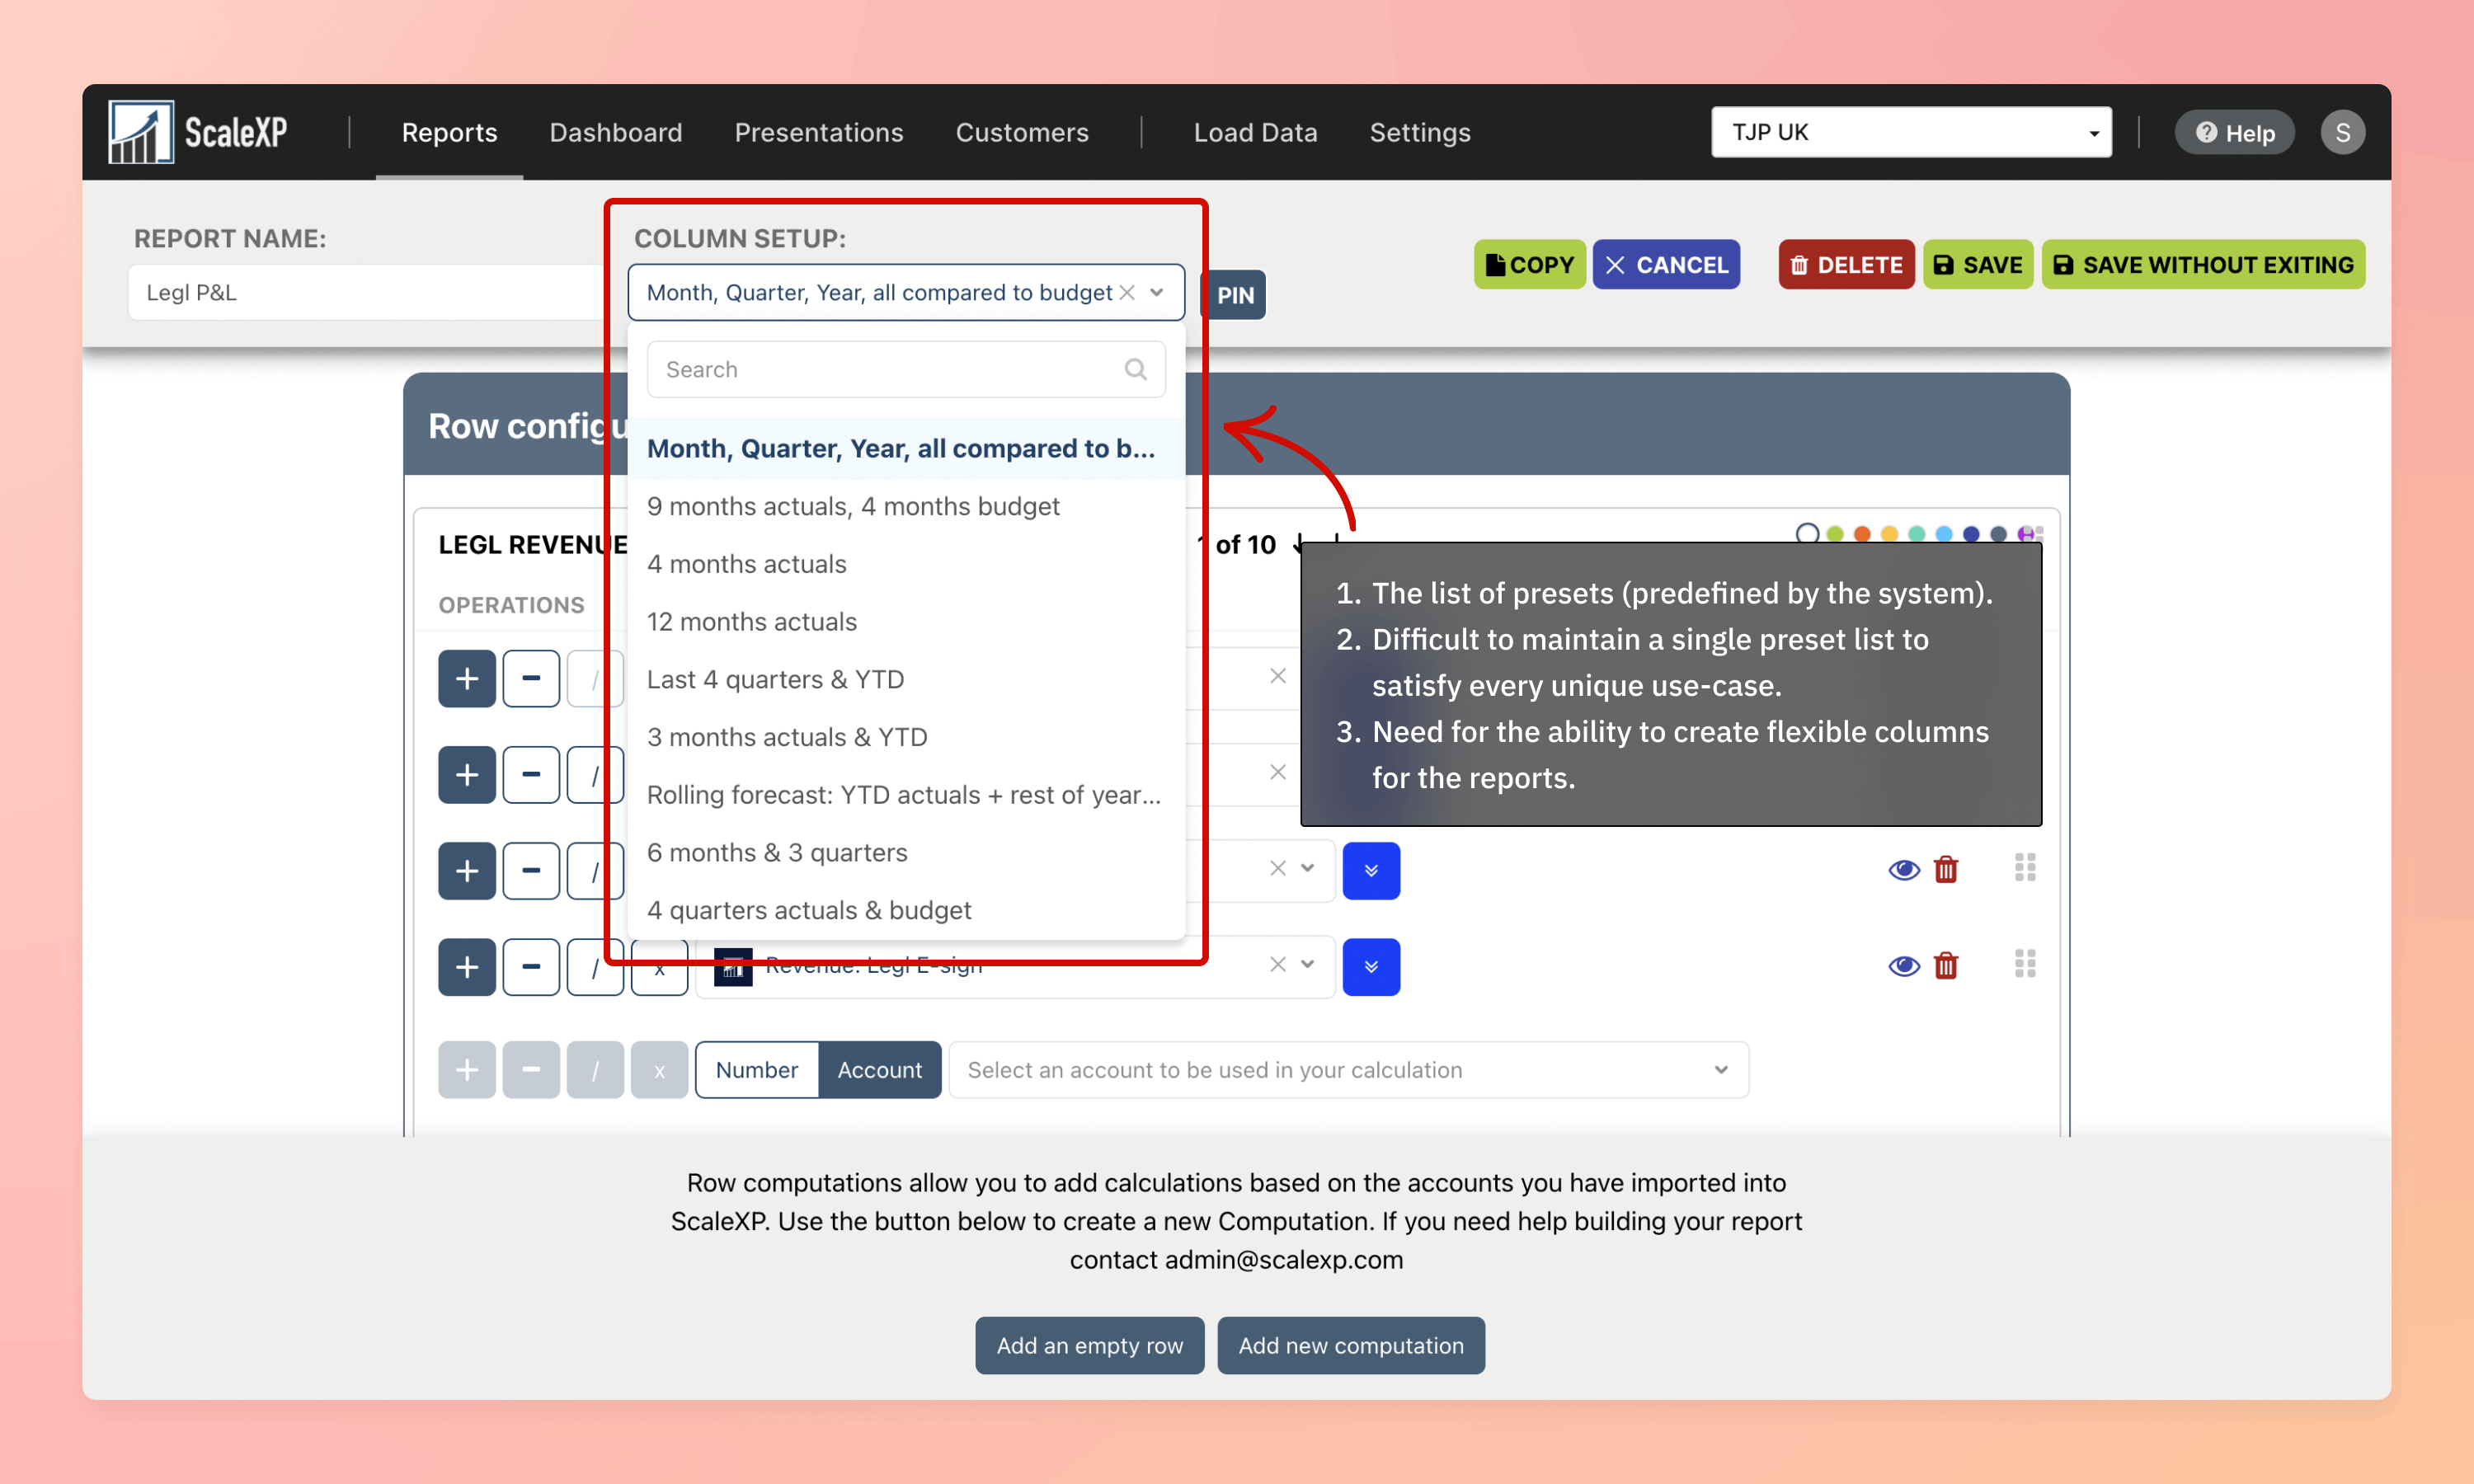
Problem 1: Lack of flexible column setup in reports.
Problem 2: Lack of order of operations in report rows
ScaleXP pulls in financial and sales data from Xero, HubSpot, Salesforce, etc. While configuring rows in a report, the user defines computation at each row-level using the above data. All accounts (sub-entities) that are part of this computation are displayed as sub-rows. The computation for row calculation is linear, which worked great for financial reports, but was restrictive for calculating other complex business metrics (e.g. Customer acquisition cost).
There was a need for the system to support tree structure computation (instead of linear), enabling users to control the order of operation with the help of an intuitive user interface.
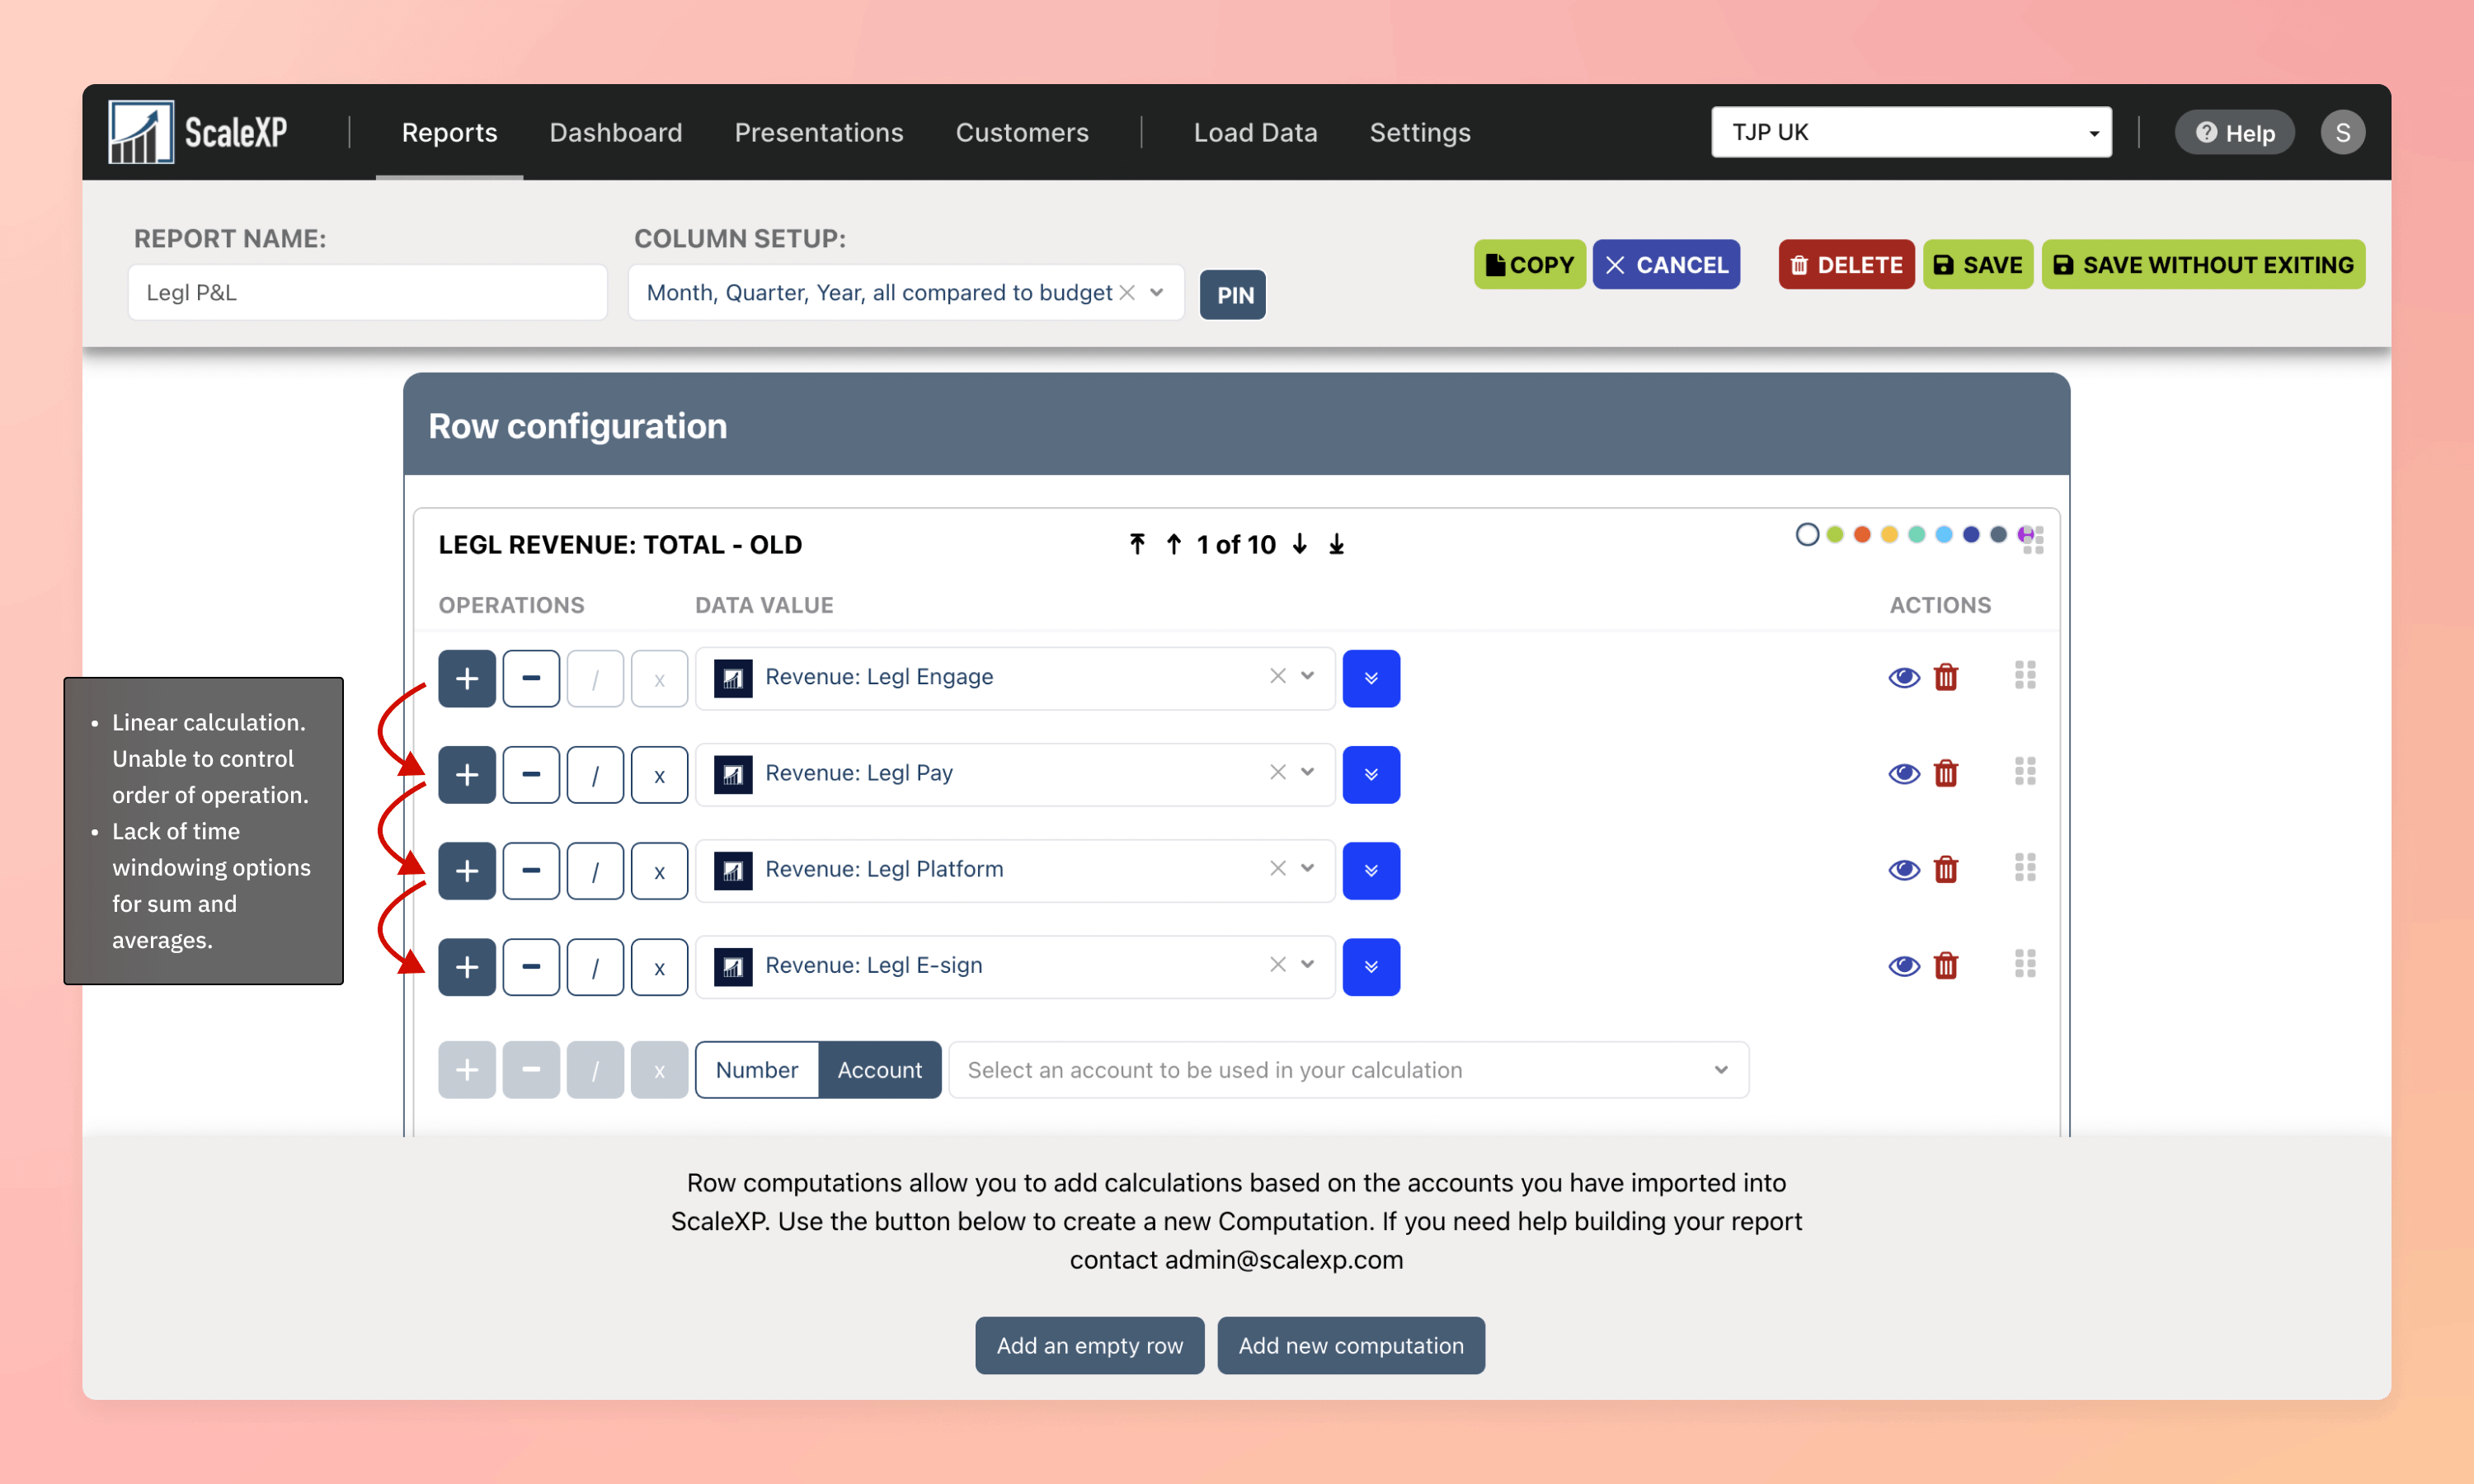
Problem 2: Lack of order of operations in report rows.
Research
The team at ScaleXP is in touch with the customers on a regular basis via Zoom video calls. These meetings are a source of the long list of customer inputs, reviews, frustrations; giving us an insight into their behavior about platform usage and allowing us to explore ideas with them about how the platform can improve their workflow.
With no product manager in the team, I took the responsibility to conduct these interviews and share the notes with the team at the end. Each input is recorded, tagged, and analyzed to narrow down and prioritize items to pick up in the product sprint.

Consolidated notes from customer interviews. Content blurred.
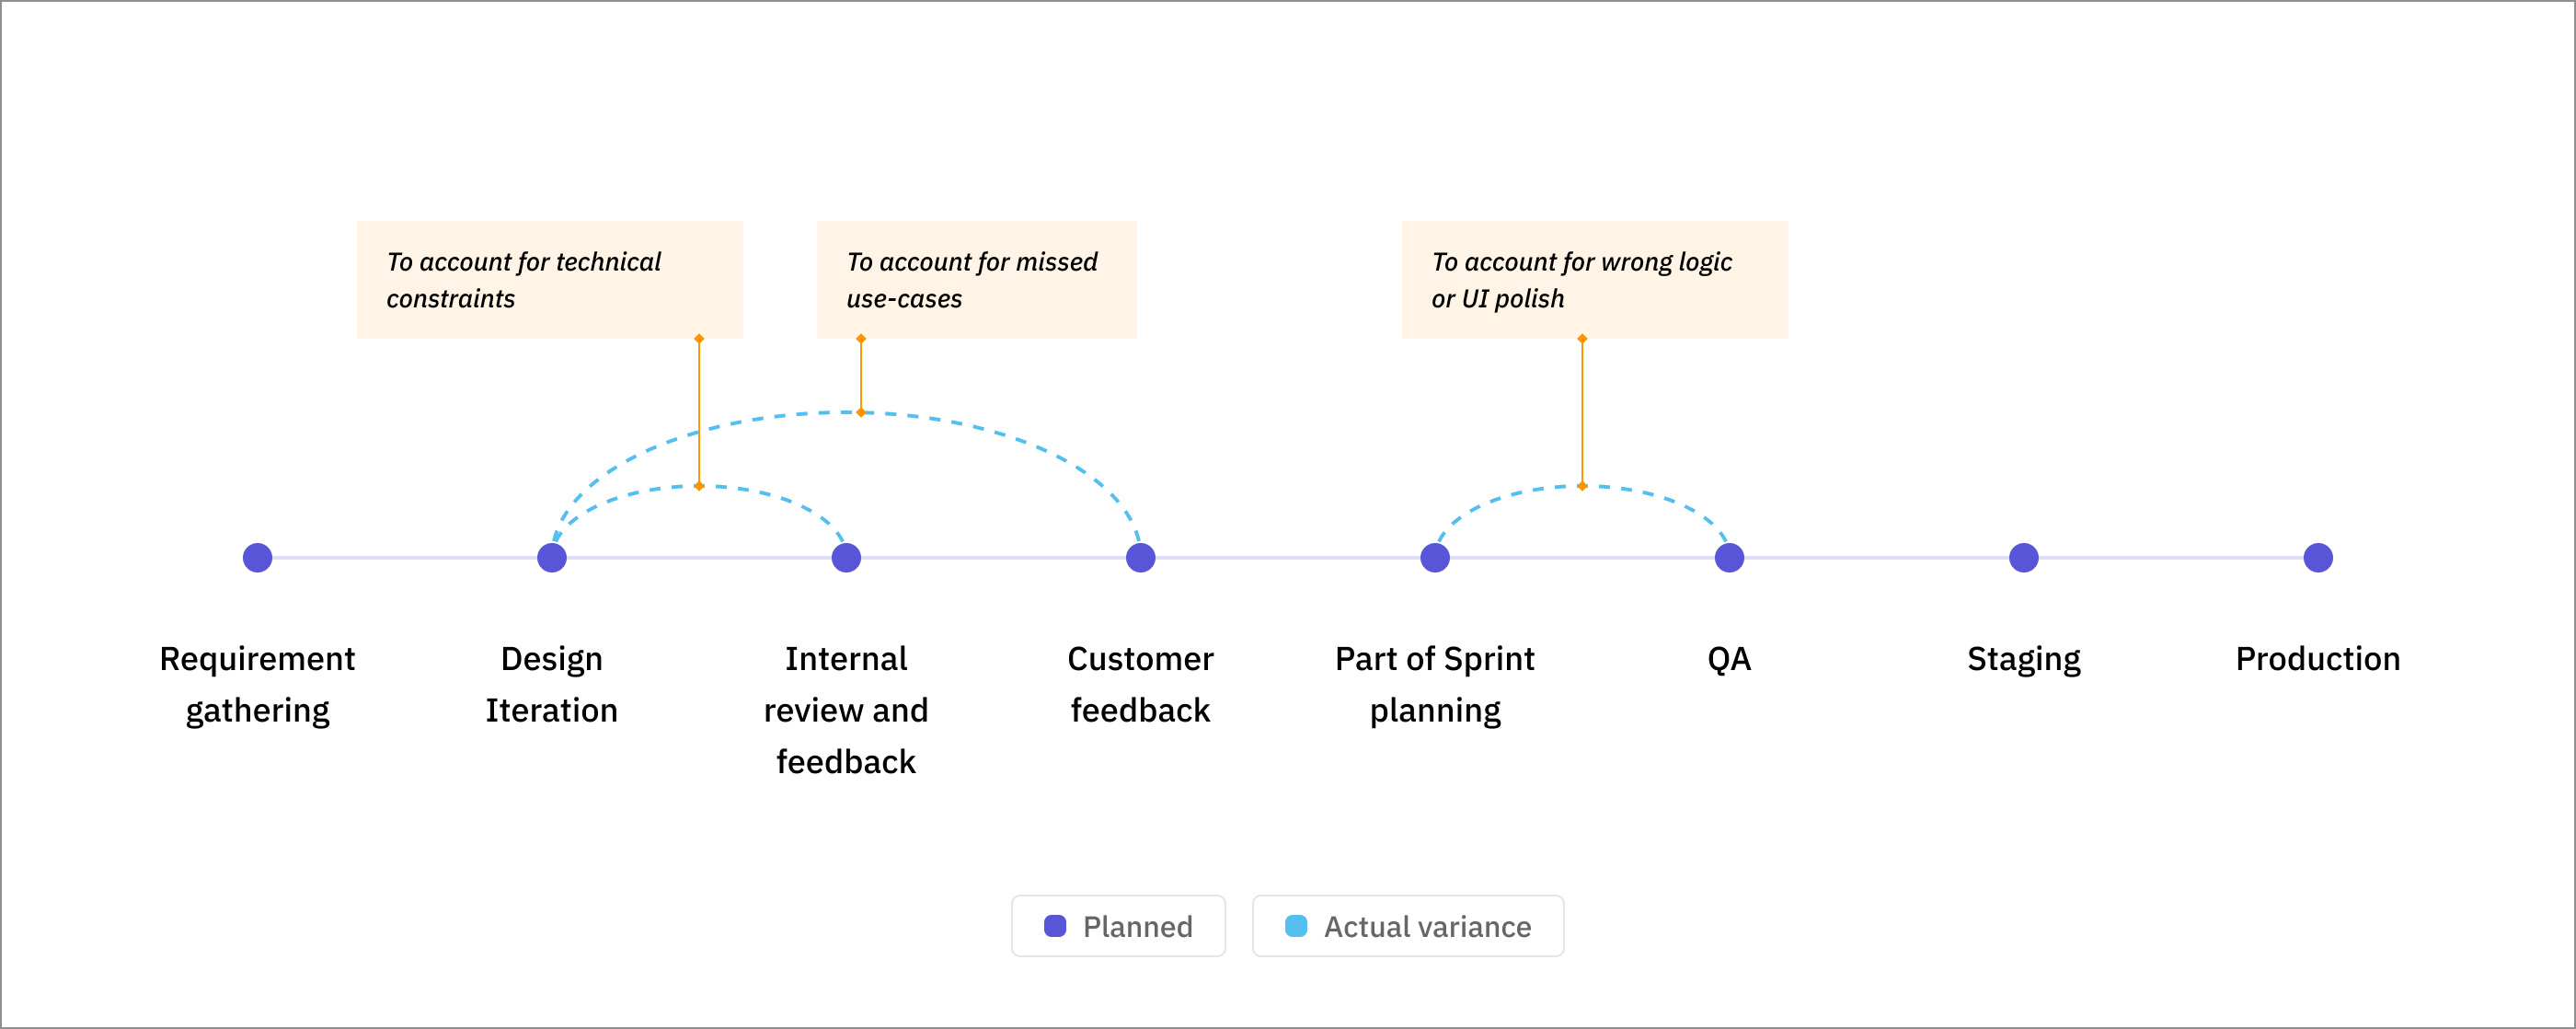
Process: Planned vs Actual
Solution to Problem 1: Flexible column setup
Customer insights and iterations
Some of the insights noted or communicated during our feedback sessions with customers:
- Not all time-series reports are based on the financial year. Some are based on the calendar year. This is applicable only if the financial year and calendar year are different.
- Frequent use-case: Comparing actual data with Target or forecasting data in subsequent columns.
- Allowing entity breakdown for a consolidated organization will enable analyzing org-wide data in one place, instead of switching to an individual entity account every time.
- In edit mode, it is easier to visualize columns when stacked horizontally (as compared to stacked vertically).
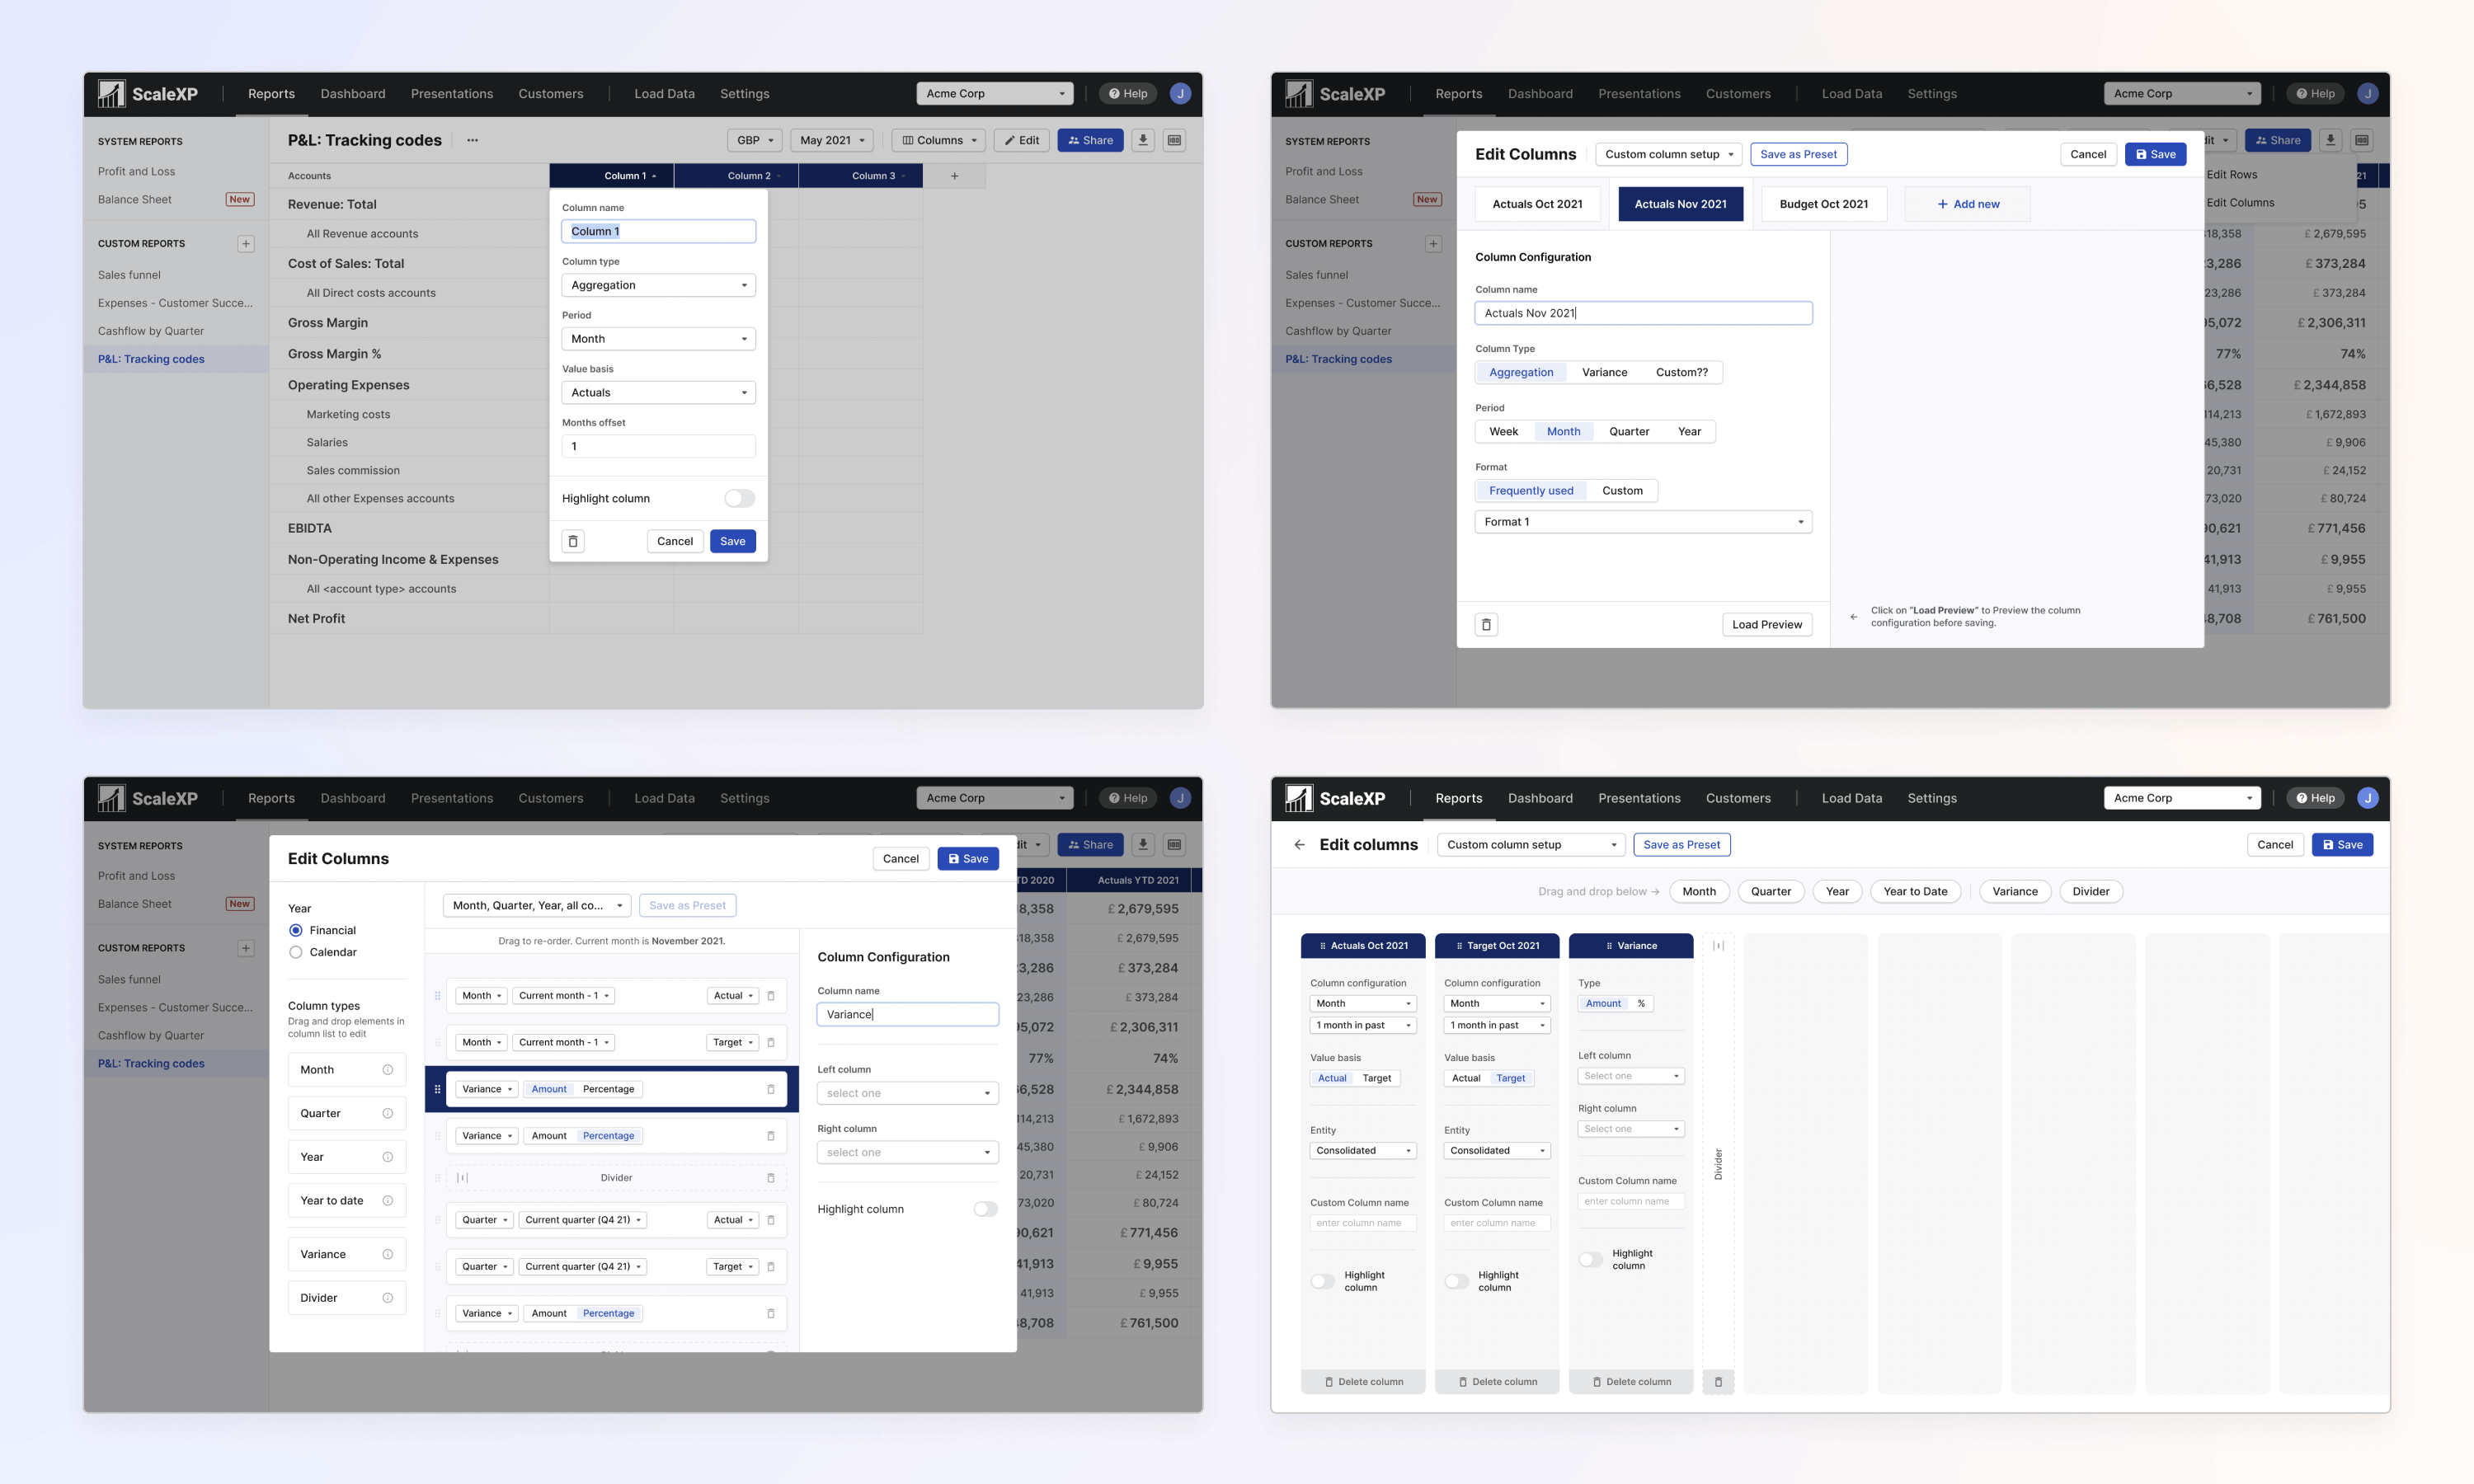
Iterations for flexible column setup
Final design
Based on customer insights, internal feedback, and technical restrictions, the team was able to freeze on the design below:

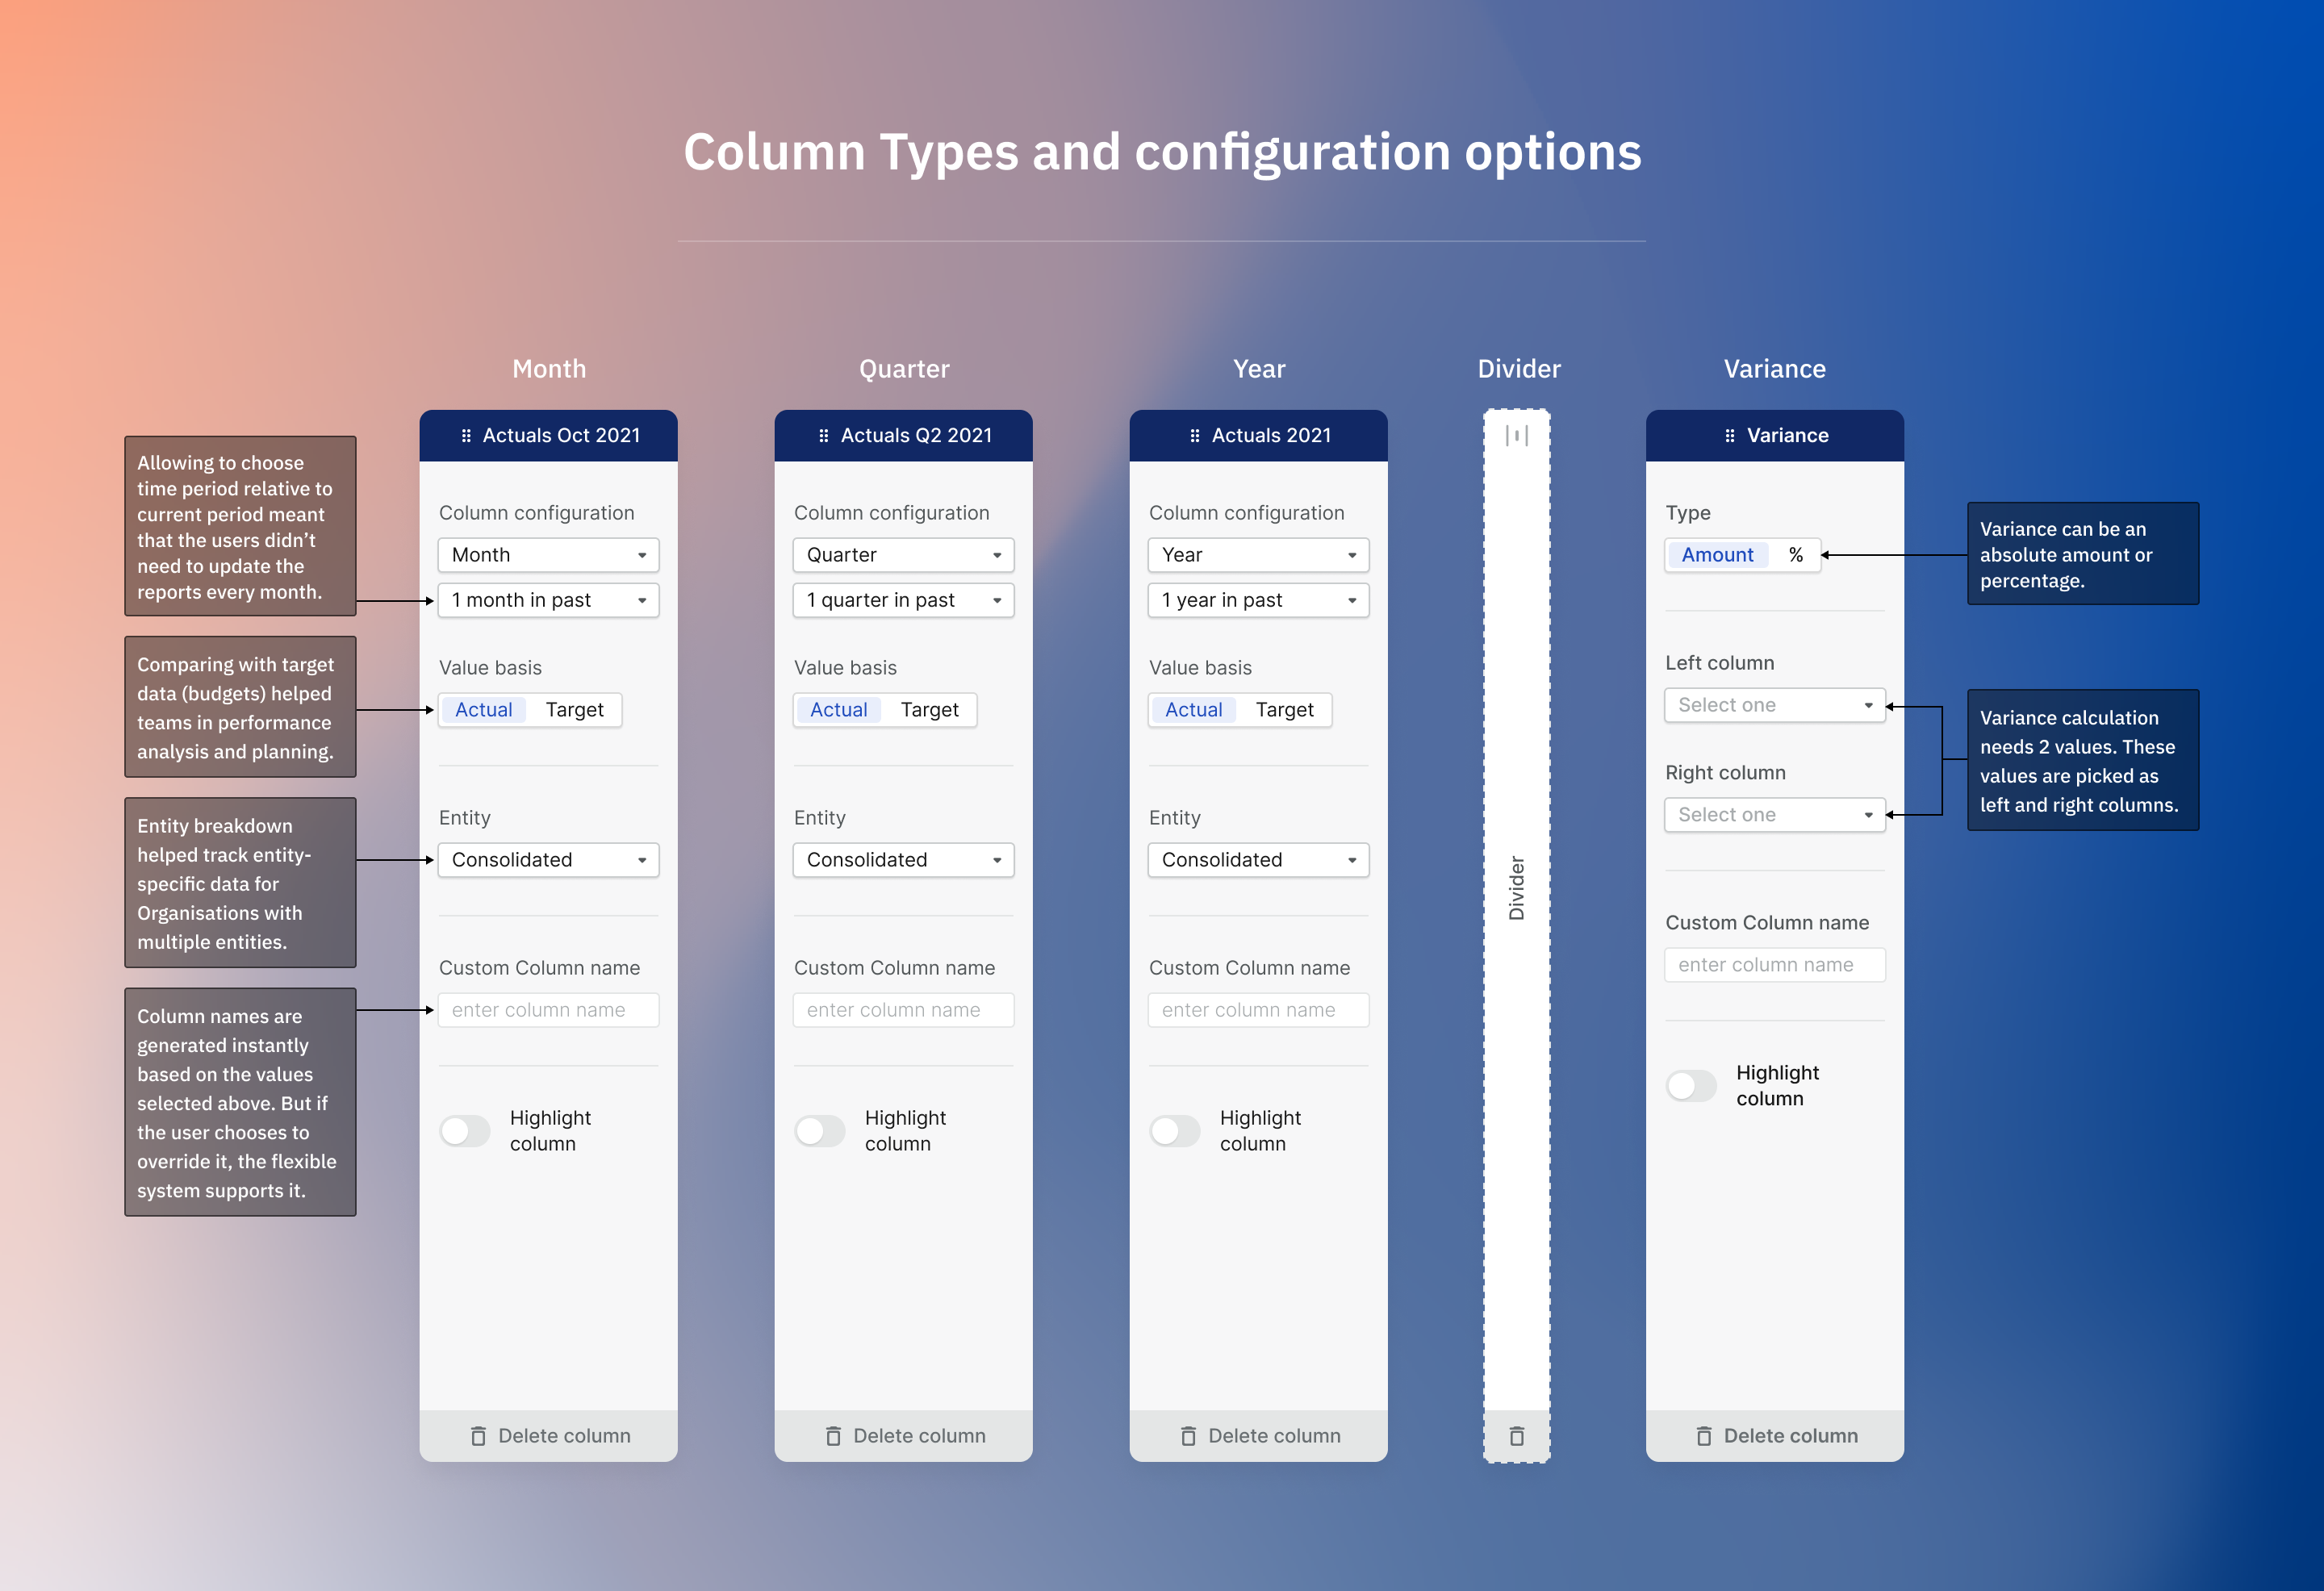

Base grid unit: 4px
Solution to Problem 2: Row editor design update
Customer insights and iterations
Some of the insights noted or communicated during our feedback sessions with customers:
- In its current state, it is intuitive to create a report (with trial and error in case of query), even without the need for help documentation.
- The existing report builder covers 90% of business use cases. No need for drastic change.
- Financial reports primarily used “Sum” and “Subtract” operations. Order of operations will be very useful in Sales and management reports (e.g. CAC).
- Once defined, the metrics should be re-usable. Defining the same metric calculation in multiple places is both error-prone and redundant.

Iterations for row computation editor
Final design
Based on customer insights, internal feedback, and technical restrictions, the team was able to freeze on the design below:
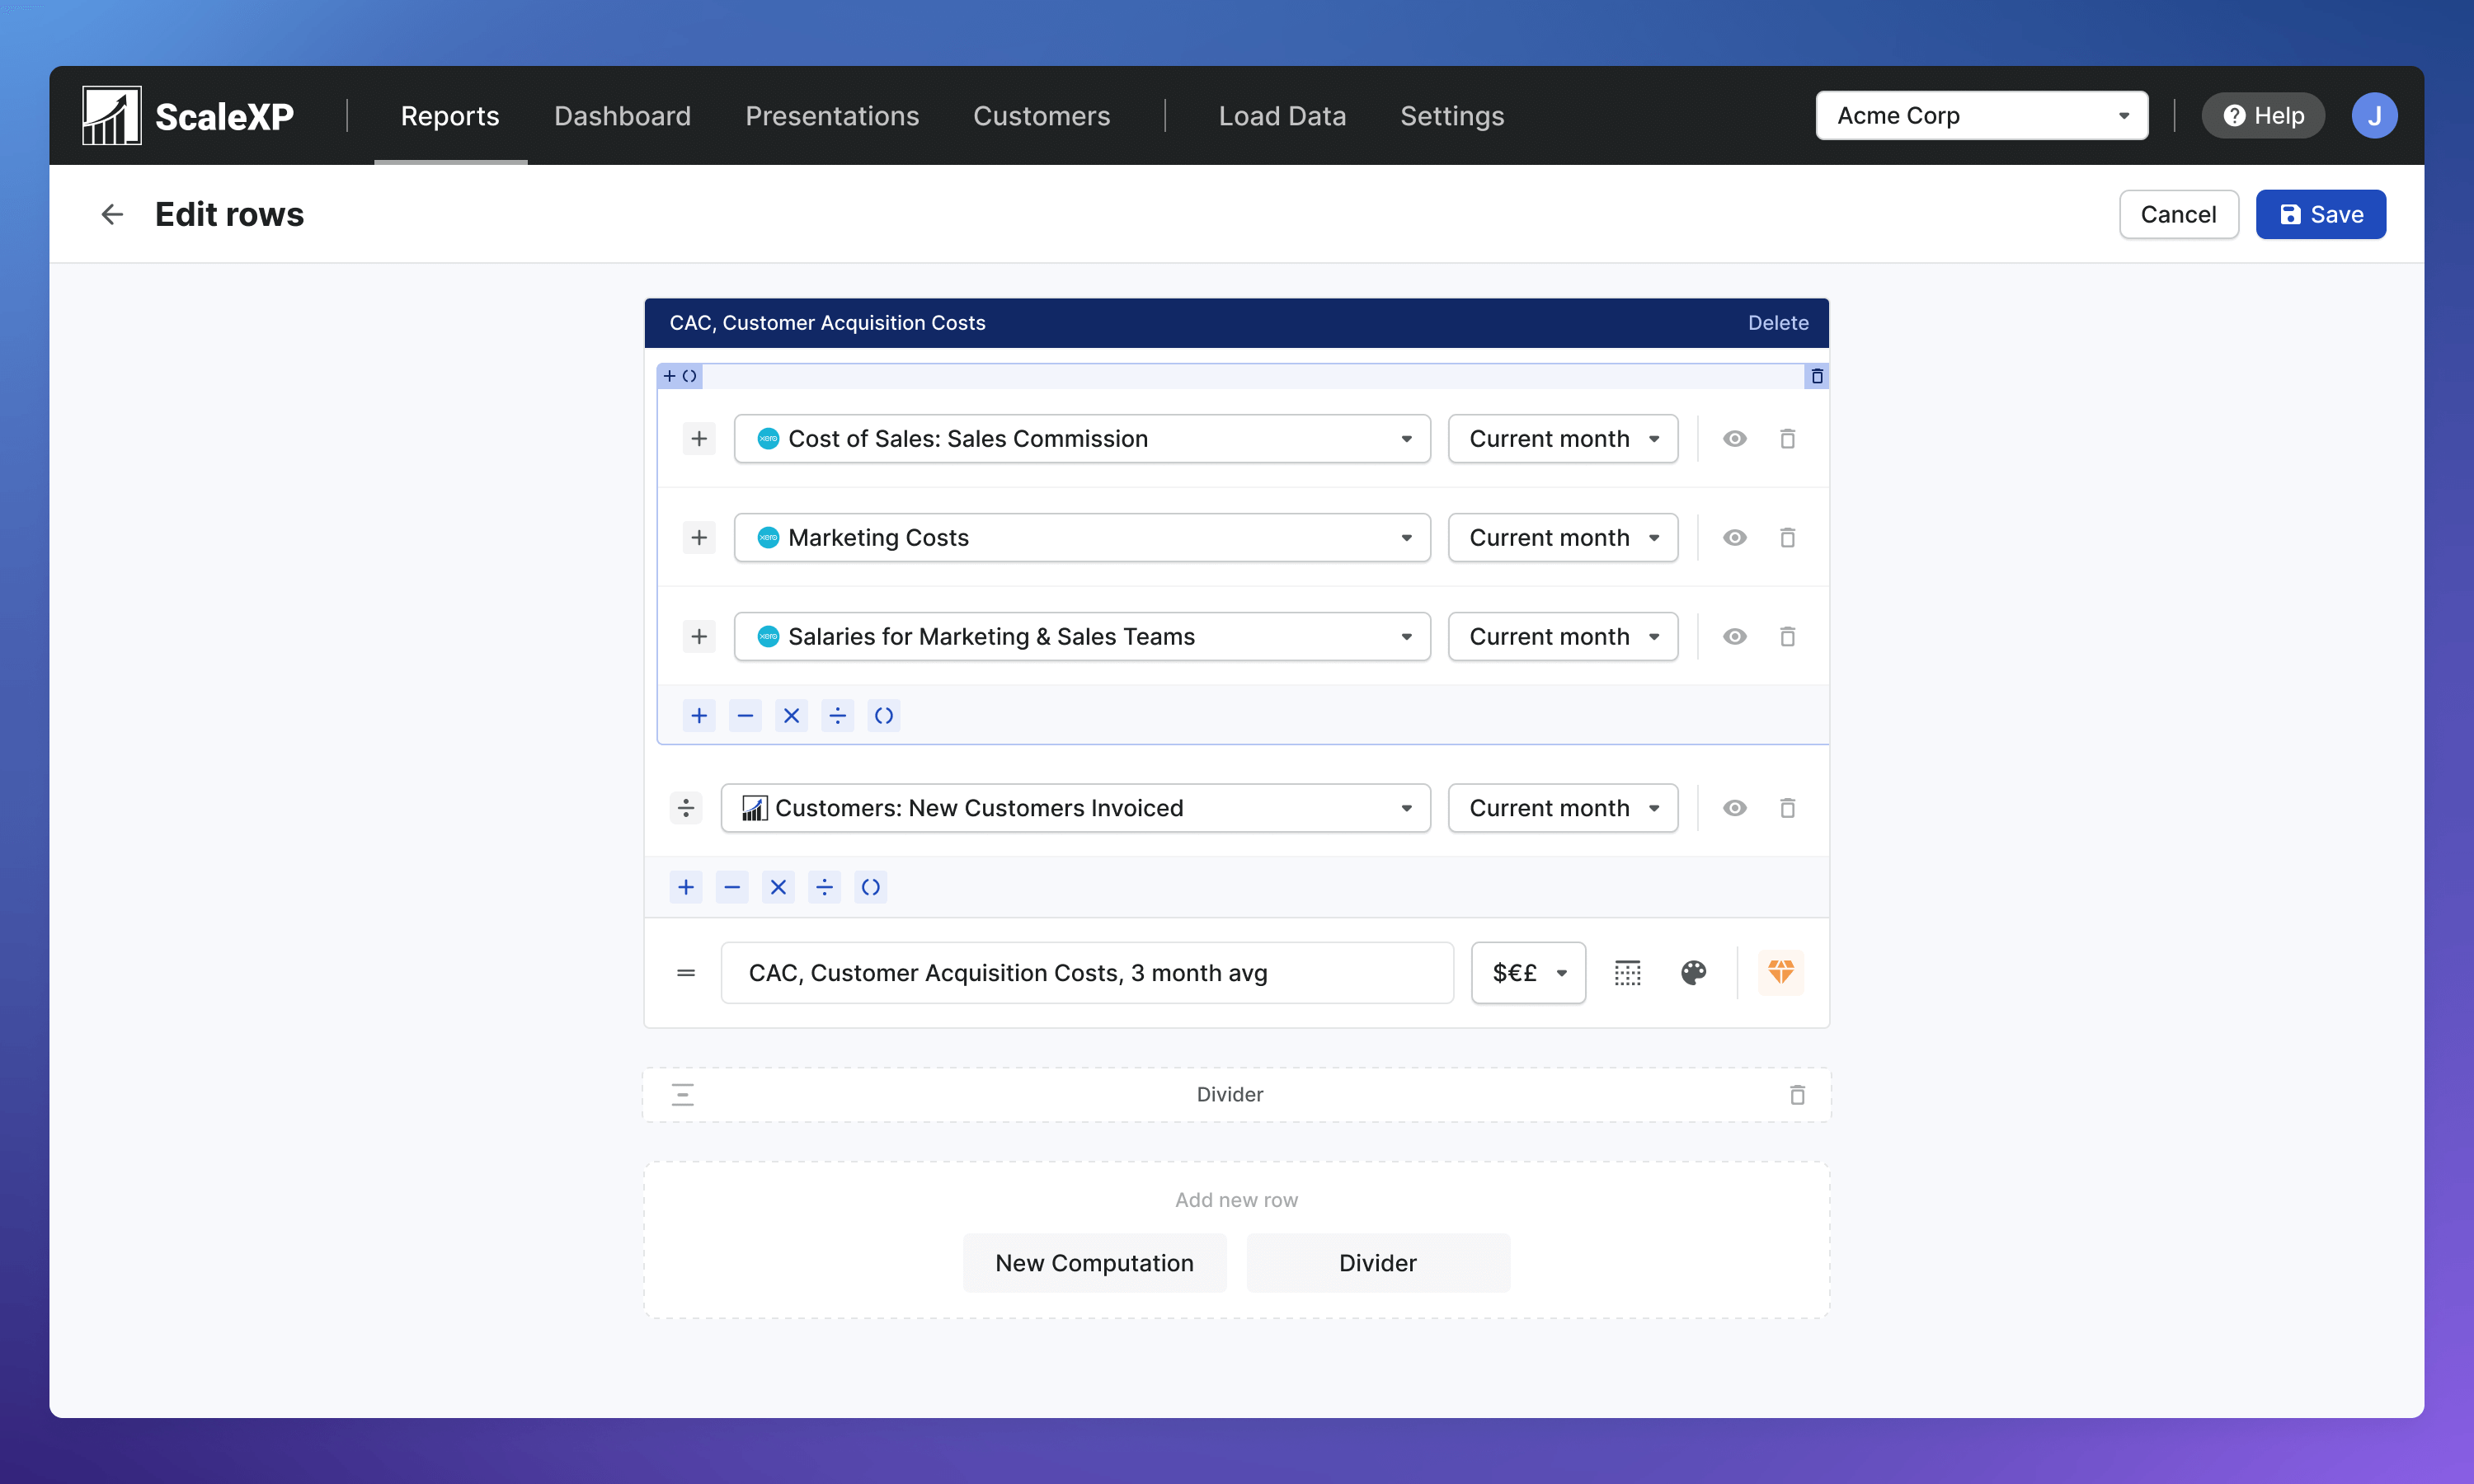
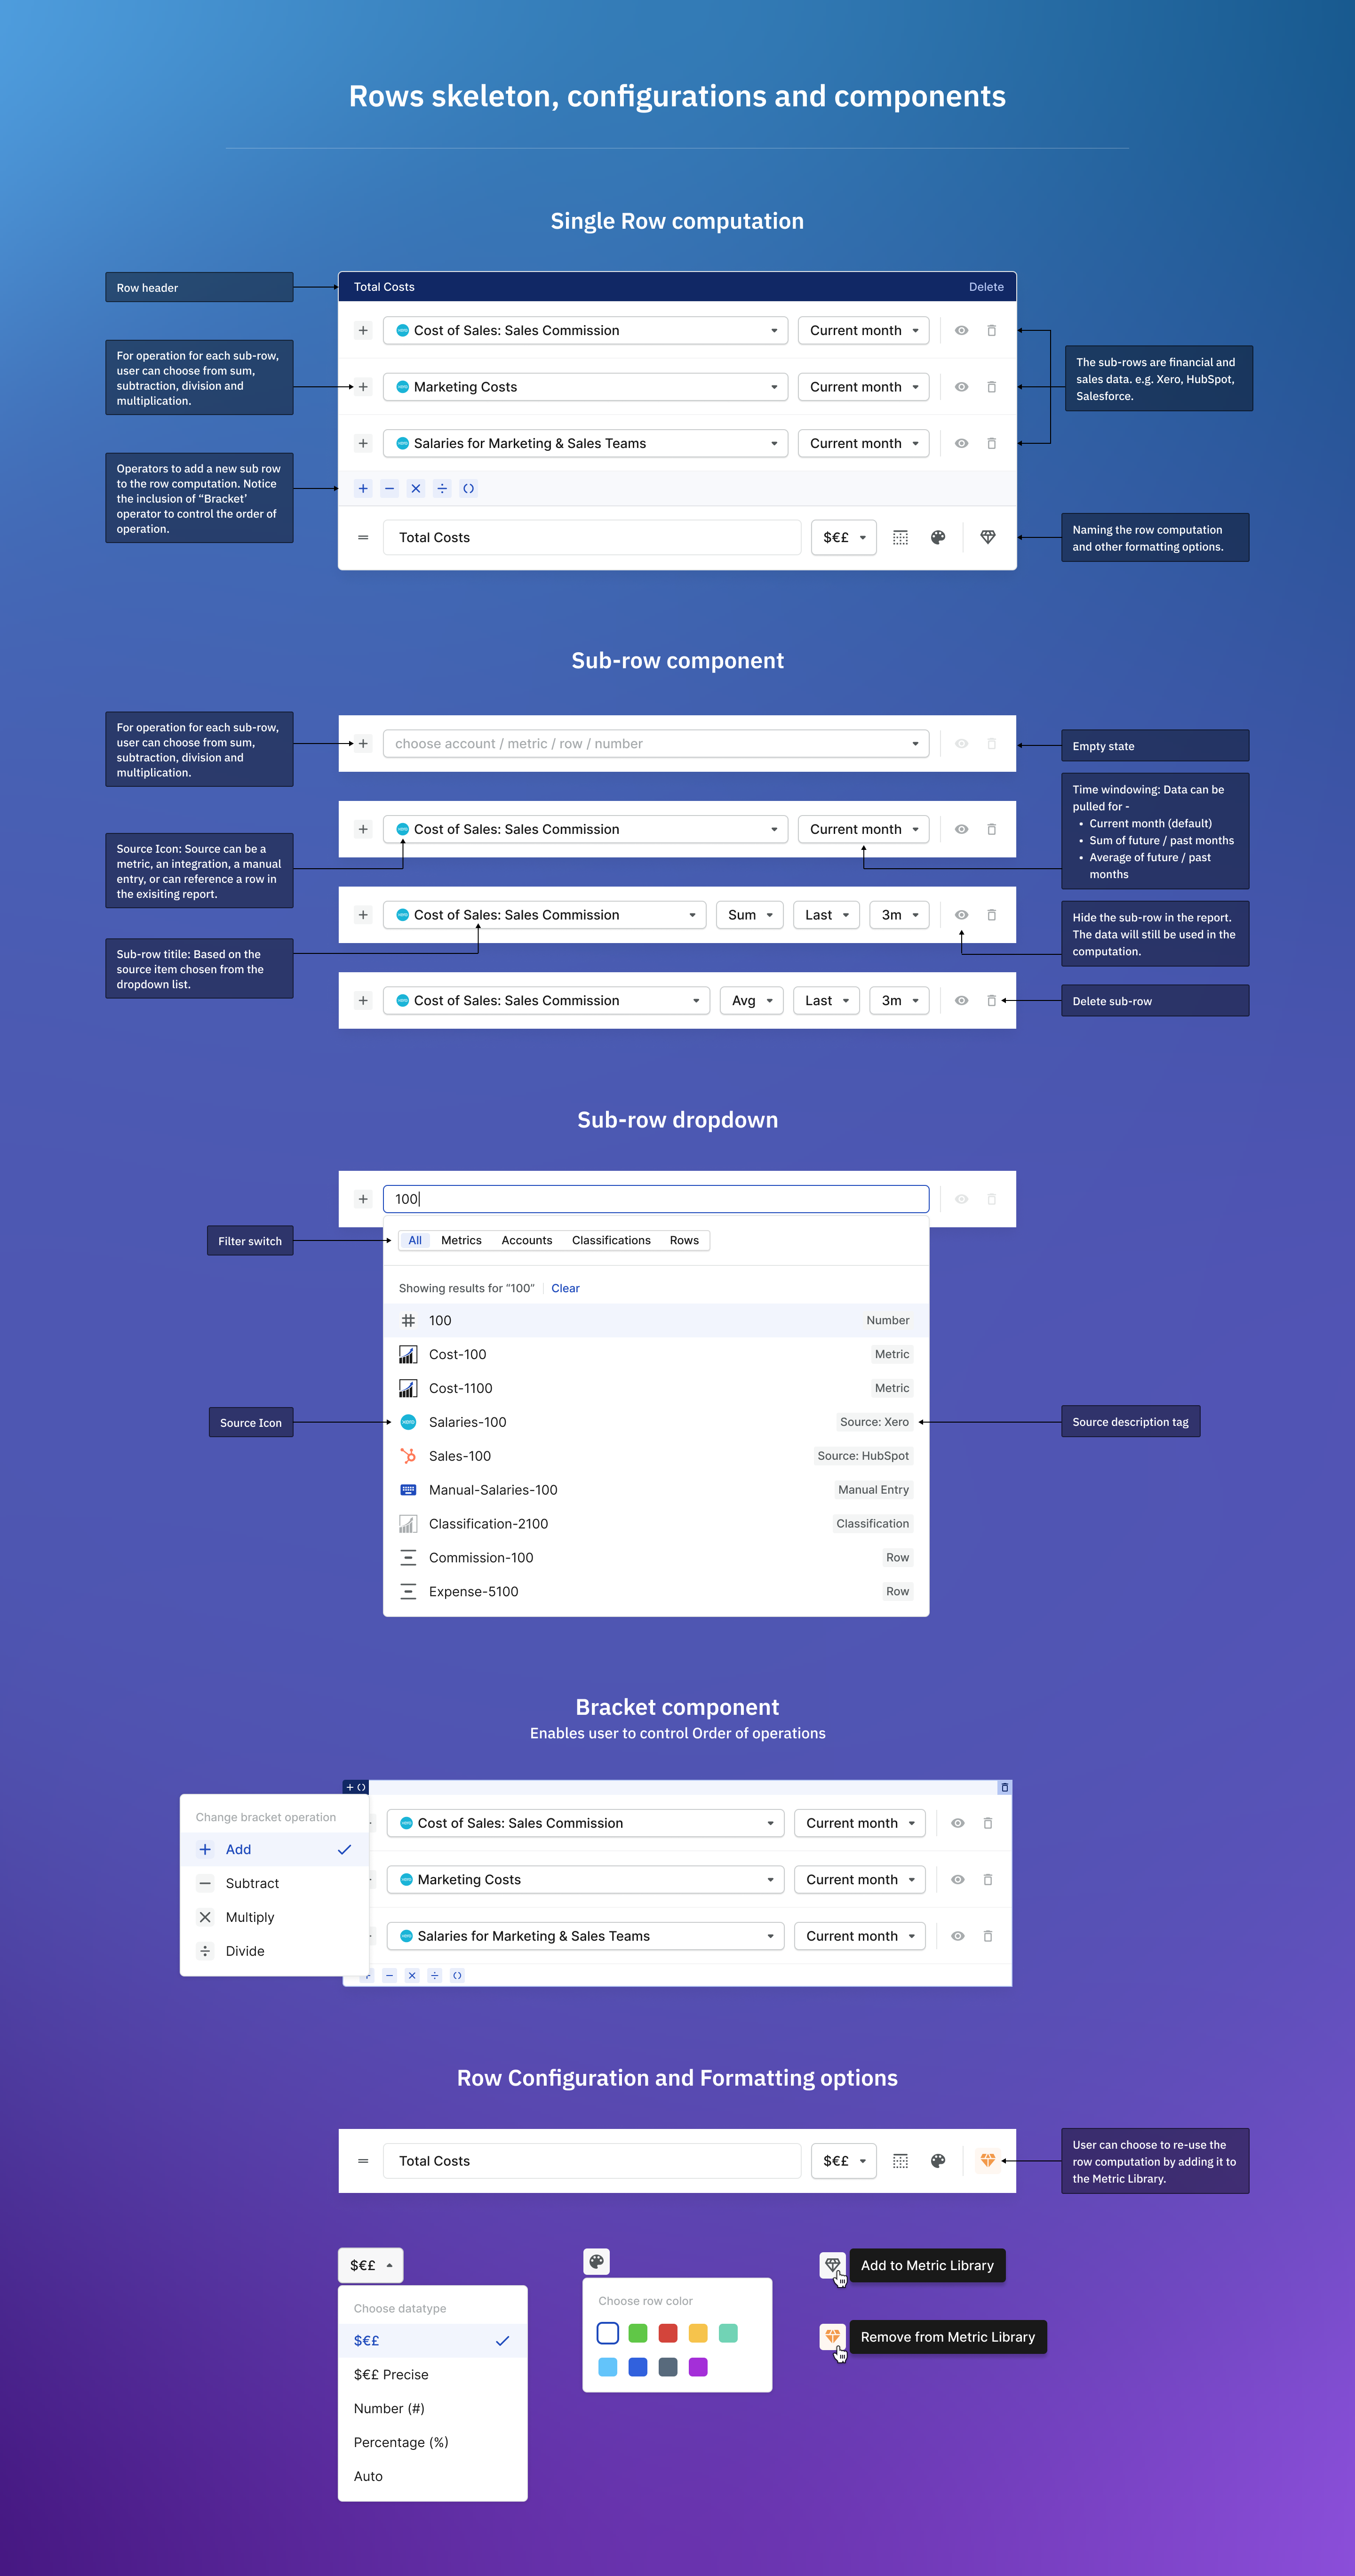
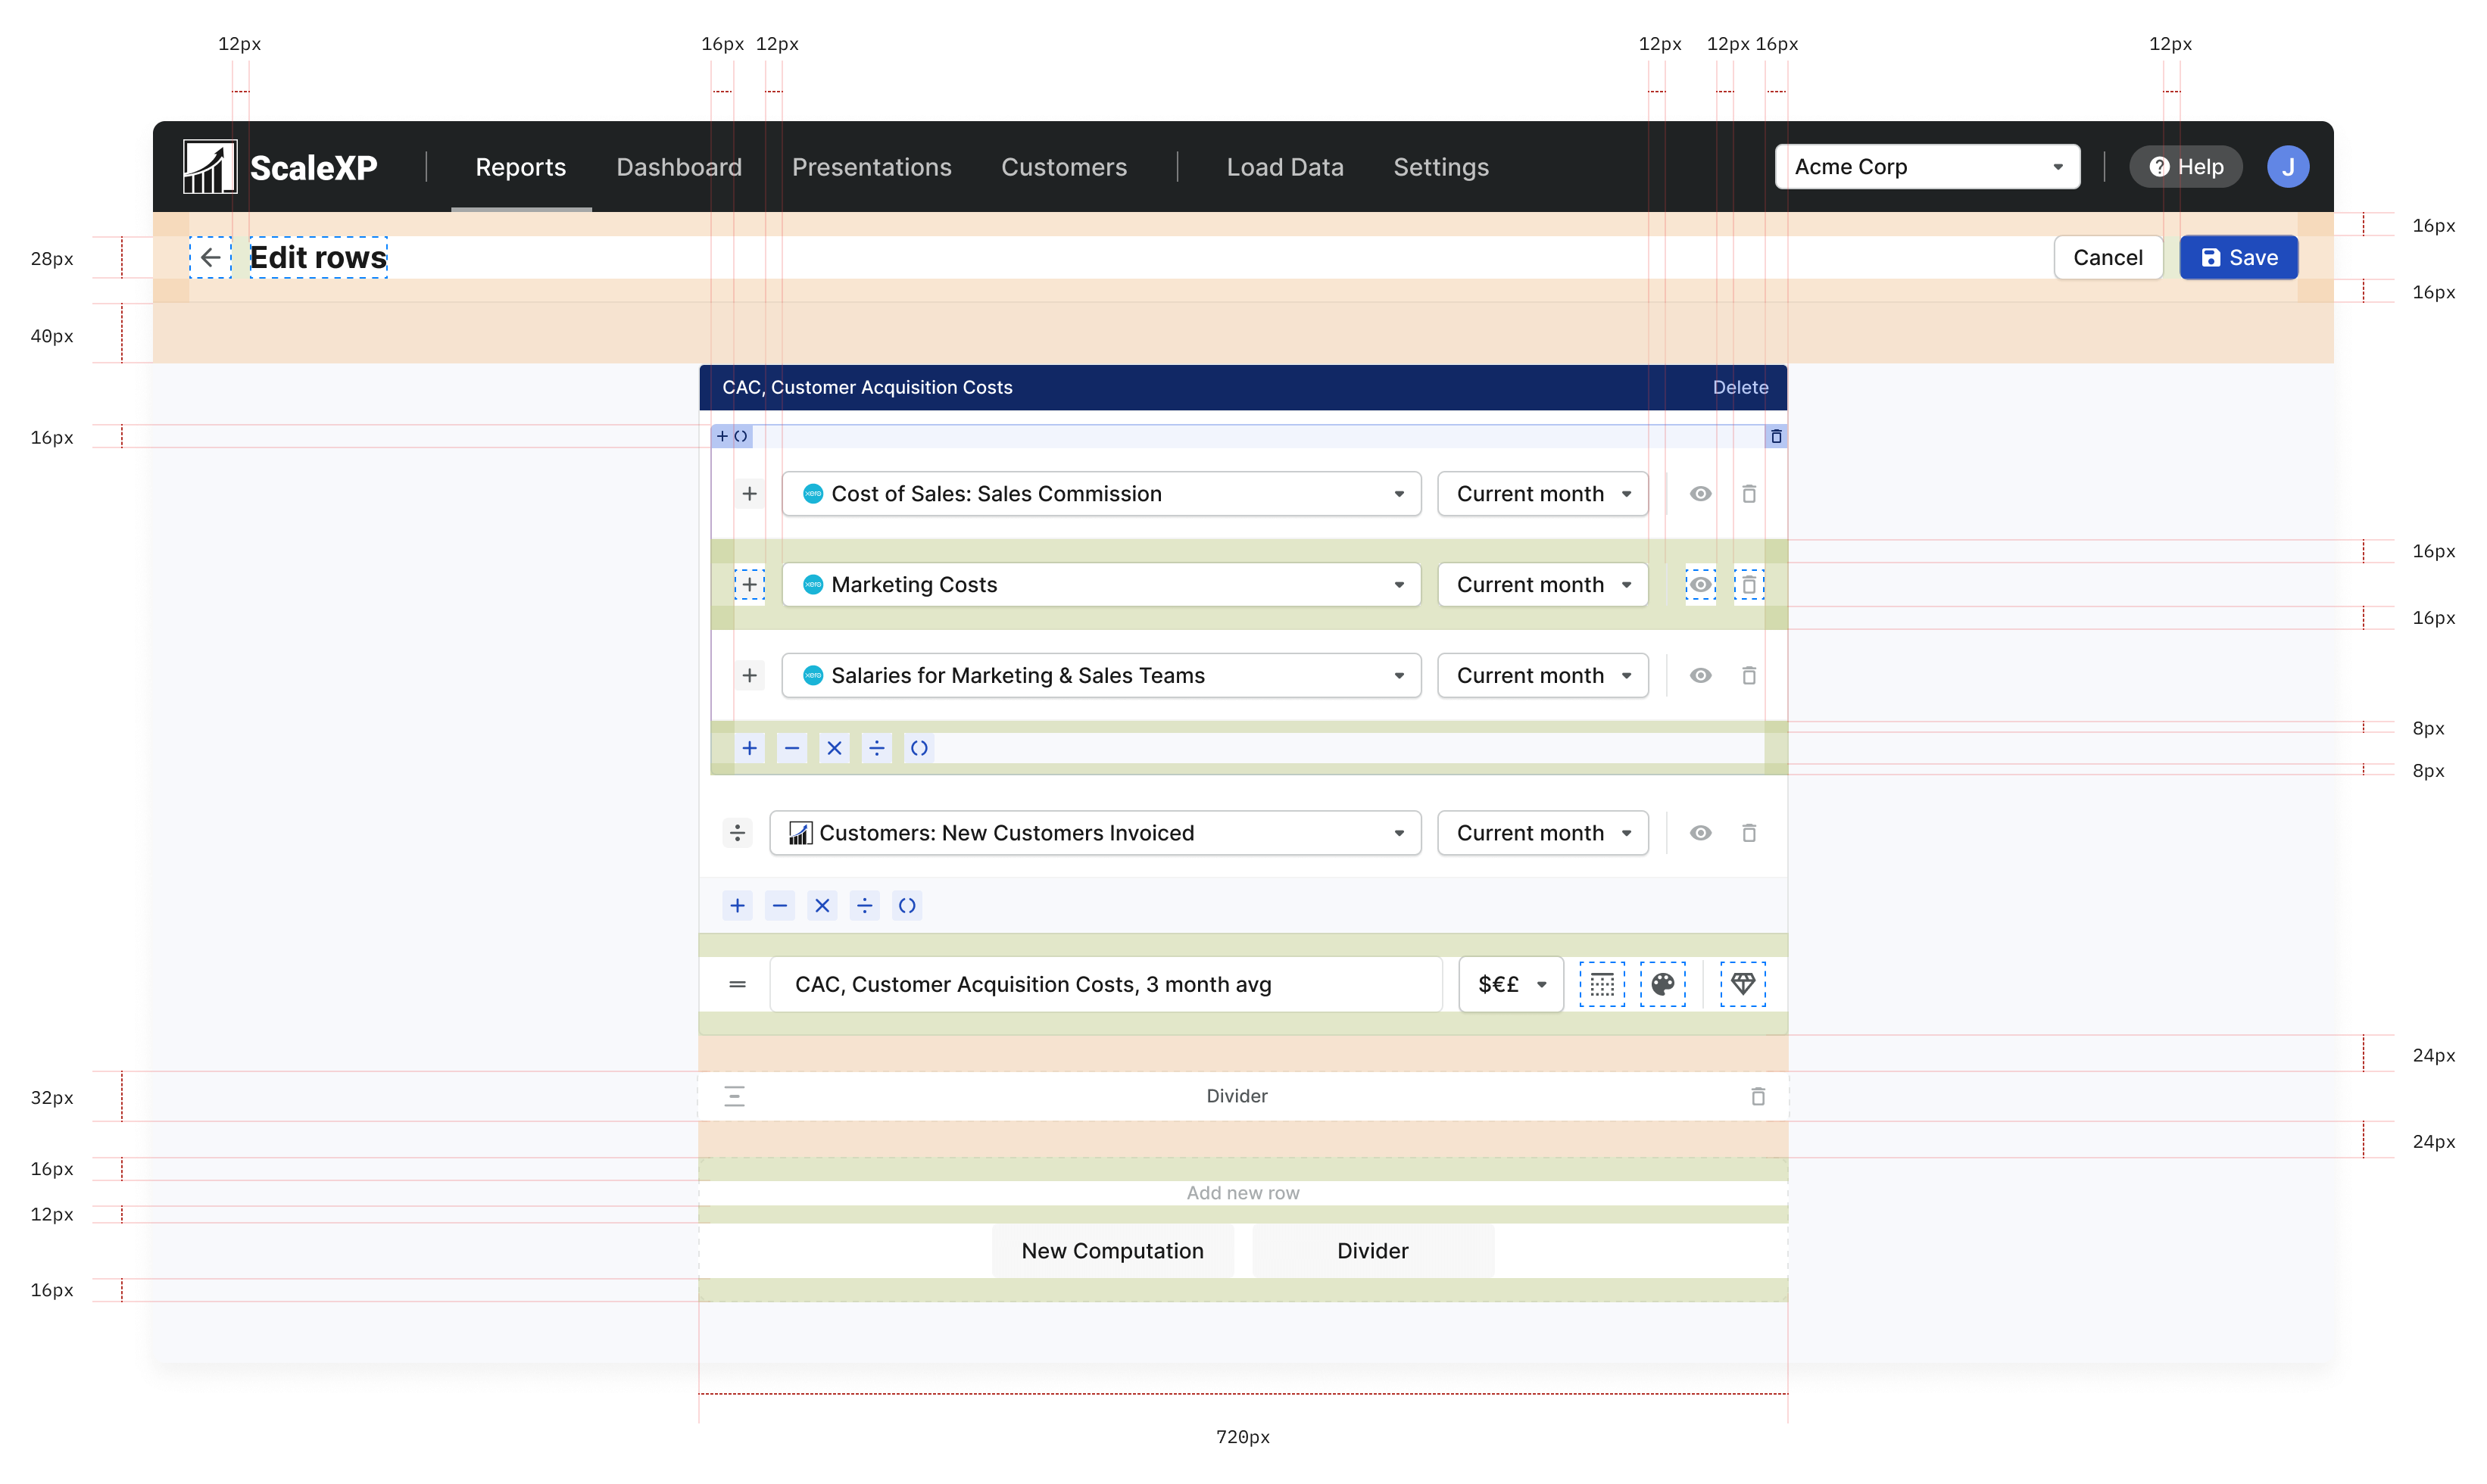
Base grid unit: 4px
Impact
Improved product stickiness with Metric library
Currently, all the data in the system comes through accounting or CRM integrations. This remained a major vulnerability in product retention as ScaleXP did not manage any raw data.
The metric library is one of the first steps in this direction. Customers creating custom computation rules on ScaleXP, tailored to their business use-cases, improves product stickiness as it becomes difficult for them to switch to any other system.
Improved adoption among Sales and management teams
While defining a computation, linear operation enabled finance teams to create time-series reports with ease. But with flexible order of operations, ScaleXP was equipped to calculate complex business metrics like CAC, LTV, Booked vs Billed, etc.
This instantly broadened the ScaleXP value proposition from just being a finance team tool to a Business insights tool for Finance and Management teams. With more diverse use-cases being handled, the rate of adoption and collaboration improved significantly.